Will Donald Trump follow through on his populist campaign promises? The stock market can tell us a lot about the President-elect’s economic policies.
President-elect Donald Trump broke with Republican tradition by running on a populist platform of less trade, more manufacturing jobs, lower drug prices, better healthcare, and a promise to make the wealthy pay more in taxes. Many of these policies—e.g., less trade and lower drug prices—are expensive for corporations and certainly not a normal part of the Republican platform. Which set of policies will win? The stock market can tell us.
The election of Trump to the Presidency of the United States was unexpected. Almost all pollsters, like Nate Silver, and betting markets predicted a Clinton victory. Thus the news shock makes a perfect experiment with which to examine stock markets. We can learn what Republican economic policies will be from the movement in stock prices that night.
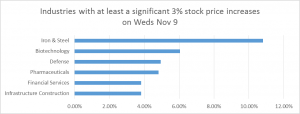
A stock price encapsulates expectations about future profits of a company. Before the election, those future profits were forecast assuming Democratic regulatory policies. By Tuesday night, November 8th, analysts had to rethink the value of each stock under a Republican regime. Many stock prices rose sharply. In the Appendix we describe the stock market data and the regression model we used to measure the changes. Below is a table, grouped by industry, of the largest winners from Tuesday to Wednesday. A full set of company-level abnormal returns is presented in the Appendix.
Why would these particular stocks change sharply in value? There was a big difference between the profits they expected to earn under a Democratic president and those expected under a Republican one. Below are some of the policies that increase profits under Republican presidents, which likely drove stock price increases. They are divided into two groups, those that represent ordinary price increases and those that represent increased government spending and therefore increased demand for an industry. Steel could go in either category, as the price increases are likely to be driven by increased tariffs on foreign steel as well as increases in demand.
Price increases:
Financial Services (banks, asset management, consumer finance, life insurance): 4 percent increase. Republicans plan to roll back banking regulations so that banks can charge more and higher fees; they plan to roll back Dodd-Frank so that banks are once again lightly capitalized and can take risks as they did before the crisis.
Pharmaceuticals (pharmaceutical manufacturers and retailers): 5 percent increase. Democrats had plans to restrain the levels and increases in the price of pharmaceuticals. Republicans have no policy to restrain pricing of pharmaceuticals.
Biotechnology (biotech): 6 percent increase. Democrats had plans to restrain the levels and increases in the price of biologic drugs, many of which are extremely expensive. Republicans have no policies to restrain price increases.
Demand increases:
Construction (building materials and fixtures, heavy construction, industrial machinery and suppliers): 4 percent increase. An increase in infrastructure construction and building raises demand.
Iron and Steel (the only firm contained in this category is the American firm Nucor): 10 percent increase. An increase in infrastructure construction plus tariffs on Chinese steel will raise steel prices.
Defense: 5 percent increase. Republicans will spend more money on military kit.
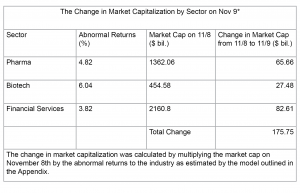
We calculate the total increase in market capitalization caused by the election for the industries in the ordinary price increases group. Each company had a market capitalization on Tuesday that changed by Wednesday morning. We add up those gains and losses for the stocks in our pharmaceutical, biotech, and financial services portfolios and get $175 billion.

We divide this total change by the U.S. population of approximately 323 million people. The change per person is $544.13. This dollar figure represents the price increases that the market expects each individual to pay in the future for drugs and financial services. Voters who voted for the Republican candidate therefore voted to transfer money from the regular worker to the stock-owning elites. An average four-person household in the United States will pay $2,176 more to banks and drug companies according to the increases in these stock prices.((The KBW Nasdaq Bank Index rose more than 18 percent between November 8th and December 1st. This increase is likely to be due to a combination of fee increases, lending changes, changes in risk, and expectation about future interest rates. In the analysis above we effectively assume 3.8 percent of the total change is due to higher prices paid by consumers.))
However, there is good news if you belong to the top 10 percent of the U.S. asset holders. The wealthiest 10 percent of the population owns more than 80 percent of national financial wealth. If the price increases are spread equally across all consumers, the top decile will pay $544 but receive $4,353 in return via the stocks they own (less the bonuses paid to top executives). The wealthy are far better off (financially) under Republican policies. Of course, Trump did not campaign by saying he was going to take money from workers and give it to corporations—indeed, he said the opposite. But Republican voters elected a party that normally gives corporations permission to raise prices, and markets expect those corporations to take advantage of the opportunity.
Which stocks lost ground? For-profit hospitals, as investors realized that they would be treating many more uninsured patients. Renewable energy, as renewables will have to compete against cheaper dirty energy. Companies that imp
ort or export products from Mexico, on fears of a halt in trade.
The Republican party’s policies—lower wages and more expensive banking, drugs, and other products (along with cancellation of health insurance and dirtier air)—will add up to more economic pain for workers. Did regular Republican voters want their social agenda enough to give all this income to elites? The markets are telling us they did.
Appendix:
Data Source and Collection:
Daily stock prices of the S&P 500 firms were collected over the past two years using Datastream. The industry designations from Datastream were then used to build more informative sector categories.
The average event return in the S&P 500 was 2.55 x 10⁻¹² which is very close to zero.
Empirical Model:
The event study was performed using the usual capital asset pricing model shown below and an event window of 1 day:
rit = αI + βirmt + γiDt + εit
where
rit is the stock price of firm i at time t
rmt is the S&P 500 price index at time t
Dt =
You can find the list of individual corporate abnormal returns here.
(Note: Fiona M. Scott Morton is the Theodore Nierenberg Professor of Economics at the Yale University School of Management where she has been on the faculty since 1999. Her area of academic research is empirical industrial organization, with a focus on empirical studies of competition in areas such as pricing, entry, and product differentiation.)


