

In the United States, Social Security accounts for nearly 60 percent of the total wealth of the bottom 90 percent. Once Social Security is properly accounted for, rather than rising, in the last three decades top wealth shares are flat.
It is widely believed that wealth inequality in the United States has increased substantially in the last three decades. But this conclusion—reached by various studies—adopts Piketty’s (2014) definition of wealth as the total value of all assets owned by households, net of debt; or “marketable wealth.”
This measure importantly ignores wealth accrued through social programs, like Social Security. In influential works, UC Berkeley professors Emmanuel Saez and Gabriel Zucman argue that this omission is sensible, because incorporating the wealth from public programs would be a slippery slope, calling for including the present value of future healthcare benefits, education, and defense spending. Since it is not clear “where to stop,” they contend a narrow wealth concept is preferable.
In our recent work, Social Security and Trends in Inequality, we argue that narrowly defined marketable wealth is probably not the right place to stop.
Our focus is on Social Security retirement benefits, a large and growing source of wealth for most Americans. By 2016, Social Security accounted for nearly 60 percent of the total wealth of the bottom 90 percent. Unsurprisingly, its exclusion paints an incomplete picture of inequality trends.
Prior work that focuses on marketable wealth concludes that inequality has risen in the last three decades; we show that once Social Security is properly accounted for, rather than rising, top wealth shares are flat.
One issue with marketable wealth as a concept is that policies that broaden the social safety net—like an expansion of Social Security—may well displace private savings, increasing marketable wealth inequality despite improving financial well-being.
Existing estimates of wealth concentration are thus unsuitable for policy evaluation, and it is imperative to develop an understanding of inequality that accounts for both private wealth and entitlements. We take a first step in this direction and show the importance of Social Security retirement wealth in understanding inequality trends.
Social Security was enacted in the aftermath of the Depression to provide security for individuals who retire or leave the labor force due to disability. Today, the program covers nearly 90 percent of workers and is the primary source of income for retired Americans.
Social Security is funded through payroll taxes and benefits are more generous to workers with lower lifetime earnings. Therefore, Social Security income is much more equally distributed than income from marketable wealth: business income, dividends, and capital gains (Figure 1).
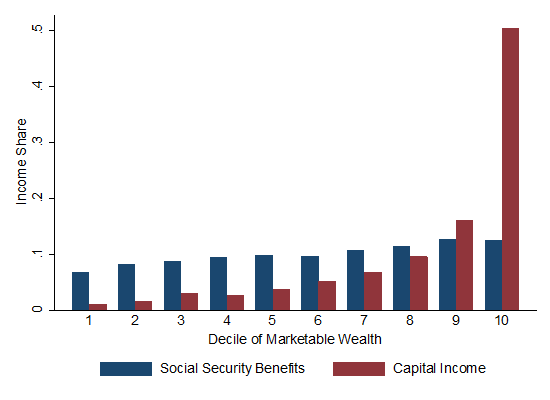
Figure 1: Distribution of Social Security Benefits and Capital income
To incorporate Social Security into measures of wealth inequality, we rely on data from the Survey of Consumer Finances, which provides triennial snapshots of marketable wealth, as well as retired workers’ Social Security benefits.
For retired workers, Social Security wealth is imputed directly using life tables and the same discount rates as government bonds. For households who are still in the labor force, the exercise is more complex, as a precise estimate of their Social Security wealth requires knowledge of their entire past and future earnings trajectories.
As such, we rely on past empirical work (Guvenen et al. 2019a,b) to simulate workers’ earnings trajectories that mimic what is observed in the Social Security administrative data, for each cohort and gender.
We then apply the tax and benefits formulas to compute aggregate Social Security wealth as the present value of future benefits, net of future tax payments. After estimating each cohort’s aggregate Social Security wealth over time, we assign a portion of it to the top 10% of the overall distribution based on the share of workers in that cohort in the top 10 percent.
This is largely a function of age. For example, 20-year old workers are essentially never in the top 10 percent of the overall population, and thus none of their Social Security wealth is assigned to the top. In contrast, the 80th percentile and above of 60-year old workers are in the top 10 percent, we assign 25 percent of their Social Security wealth to the top based on the relationship between marketable wealth and Social Security wealth for retirees, which we observe directly in the SCF.
Once Social Security is properly accounted for, rather than rising, wealth inequality is flat (Figure 2).
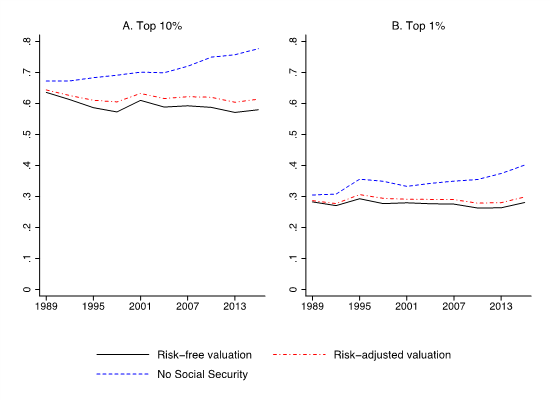
Figure 2: Top 10% and Top 1% Wealth Shares
This is because past work that excludes Social Security excludes an outsized share of the wealth of the bottom 90 percent: by 2016, Social Security wealth accounts for 58 percent of their total wealth (Figure 3).
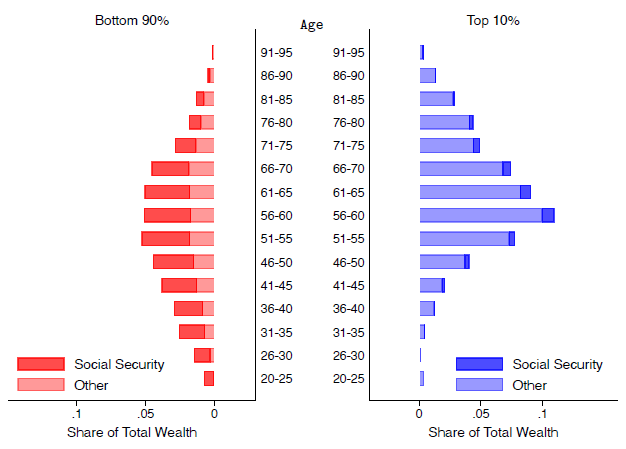
Figure 3: Total Wealth Distribution by Age – Risk-Adjusted Valuation
Why has aggregate Social Security wealth increased so substantially in the last three decades? In part, this rise is attributable to an expansion of Social Security and broad demographic shifts: The share of the population with maximal Social Security wealth, those nearing retirement but not yet retired—who have paid maximally into the program but have yet to receive any benefits, increased by 50 percent in the last three decades.
By far though the largest contributor to growth in Social Security wealth is changes in the interest rate environment: the yield curve fell across all horizons (Figure 4), increasing the present value of future cash flows. Marketable wealth experienced a similar rise in the last three decades, likely also related to shifts in the yield curve.
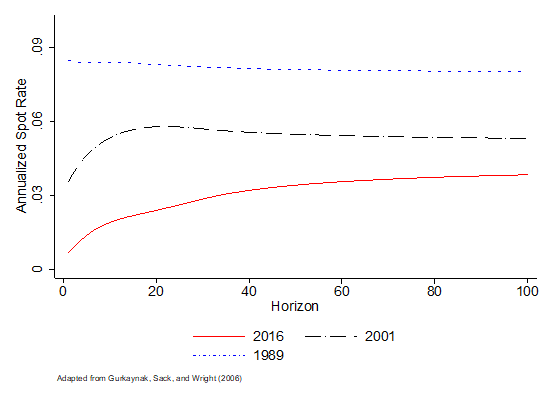
Figure 4: Market Implied Yield Curve
Several aspects of the Social Security program make an exercise like ours complex. For one, the number of benefit payments workers will receive are directly related to their life expectancy. Richer Americans live longer, and these differences have grown over time. When we adjust our baseline estimates to reflect these differences, we observe, if anything, that the top wealth shares are further reduced.
This is because while the Social Security wealth of the bottom 10 percent rises, so too does the Social Security wealth of the bottom 90 percent. The result of this adjustment is additional benefits years for those in the upper deciles of the bottom 90 percent—with higher incomes—and fewer benefit years for those at the bottom.
It is worth noting that this exercise illustrates why wealth concentration estimates that are focused on top wealth shares are incomplete: strangely, decreased life expectancy at the bottom of the distribution translates to less measured inequality.
Another issue is that the Social Security trust fund is expected to be insolvent in the next fifteen years, and benefits thereafter are exposed to policy risk. Fortunately, the SSA provides estimates of the extent to which trust fund bankruptcy will impair obligations.
Under the most extreme scenario, benefits across-the-board will be cut by 40 percent in the coming years (Figure 5). This impacts top wealth shares somewhat, but they remain substantially attenuated relative to estimates that exclude Social Security (Figure 6). This is because early cohorts are unimpacted by future insolvency, and because 60 percent of Social Security benefits is still a substantial share of total wealth for the bottom 90 percent.
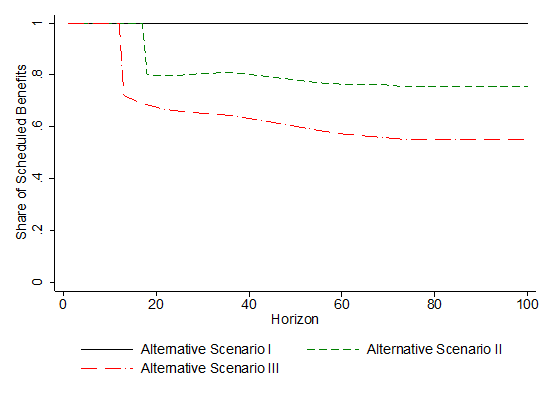
Figure 5: Funding Gap – Payable Benefits Under 2016 SSA Projections
To be sure, the estimates we offer are incomplete. Important components of wealth are excluded, like public health care benefits and disability insurance, which accrues disproportionately to those at the bottom of the wealth distribution.
Overall, our hope is to encourage the adoption of a broader wealth concept that appropriately reflects the central role redistributive social programs play in offsetting marketable wealth inequality.
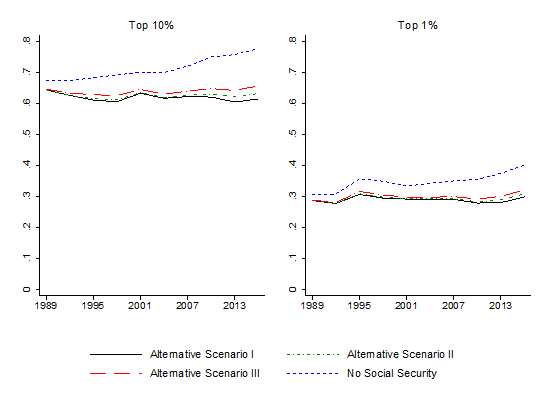
Figure 6: Top Wealth Shares – Funding Gap Adjustment
ProMarket is dedicated to discussing how competition tends to be subverted by special interests. The posts represent the opinions of their writers, not necessarily those of the University of Chicago, the Booth School of Business, or its faculty. For more information, please visit ProMarket Blog Policy.