

Italian officials have to choose the optimal strategy to end the lockdown. A policy that sends all the active population back to work avoids any GDP loss but causes the maximum number of yearly fatalities (about 40,000 in Lombardy and 36,000 in Veneto). There exist, however, several efficient mixed strategies based on the age and sector criteria that would dramatically reduce the total number of fatalities with relatively minor GDP losses.
The main question all countries are facing throughout the world is how to restart their economies while saving lives once the initial diffusion of Covid-19 has been put under control, thanks to emergency lockdown measures, and the so-called “Phase 2” can begin
We present simulations that answer this question based on data for two emblematic Italian regions: Lombardy and Veneto. These contiguous areas in the north of the country were the first in Italy to be hit by the Covid-19 outbreak (at about the same time) but experienced very different evolutions of the infection. While in Lombardy, with a population of about 10 million people, at least 12,213 people died because of Covid-19 between February 24 and April 19, 2020, in Veneto, with a population of 4.9 ml, the same happened to only 1,087 people.
A simulation of the effects of different Phase 2 strategies in these two regions is instructive for a wider audience because Lombardy and Veneto capture well the dichotomy of Covid-19 experiences that is emerging throughout the world, between areas hit very severely and areas hit more mildly by the pandemic. The two main factors determining this dichotomy are the presence of delays in reacting correctly to the early phase of the infection together with constraints in the number of intensive care places in hospitals (HC).
The simulations that we present are based on an innovative version of the SEIR model (Allen, 2017) specifically designed to capture these factors. The basic compartmental model of diseases divides the population into three compartments with homogeneous characteristics: Susceptible, Infected, and Recovered or Removed, from which the acronym SIR (Kermack and McKendrick, 1927).
The SEIR model extends the standard dynamics to the Covid case which, as for many important infections, features a significant incubation period in which individuals are Exposed, i.e. infected but not yet infectious. Since this is an essential feature of the current virus infection, using SEIR instead of SIR is crucial to ensure that the estimates are quantitatively and not only qualitatively correct.
A second substantial innovation is allowing differentiation of the population by sectors (SEC) and ages (AGE), and thus generalizing the concept of basic reproduction number (R0) to a matrix.
Specifically, our SEIR-HC-SEC-AGE model has two sectors characterized respectively by a low and a high risk of infection, which are calibrated on the basis of the information on workers’ proximity contained in Boeri et al. (2020) and Barbieri et al. (2020).
As for age, we consider 9 brackets, which are calibrated to match the initial distribution of age in the population of the two regions, and that are characterized by age-specific labor force participation rates (taken from national statistics) and by age-specific lethality, hospitalization and intensive care (IC) rates due to Covid-19 (taken from Ferguson et al., 2020).
This model can be easily calibrated to evaluate the option of letting different geographic areas to restart at different times (as currently considered by the Italian government), depending on when the virus appeared in the area or depending on the area-specific age, labor force participation and sector risk characteristics.
Figure 1 shows that our model, when calibrated for the characteristics of Veneto and Lombardy, predicts fatality rates that are very similar to those observed between February 24 and April 19 in these two regions and it may, therefore, be informative on Phase 2 strategies.
Figure 1: Observed and simulated total fatalities
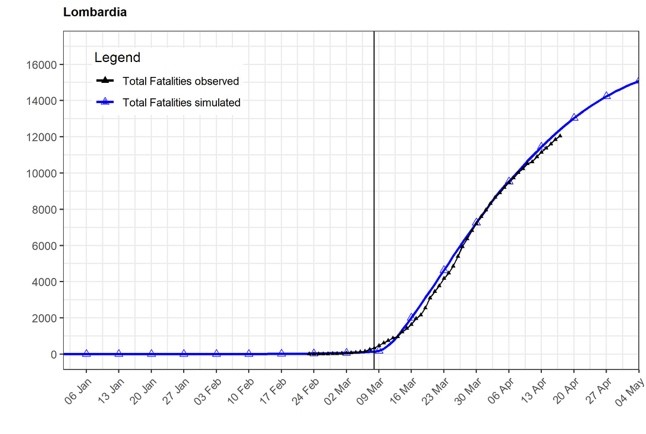
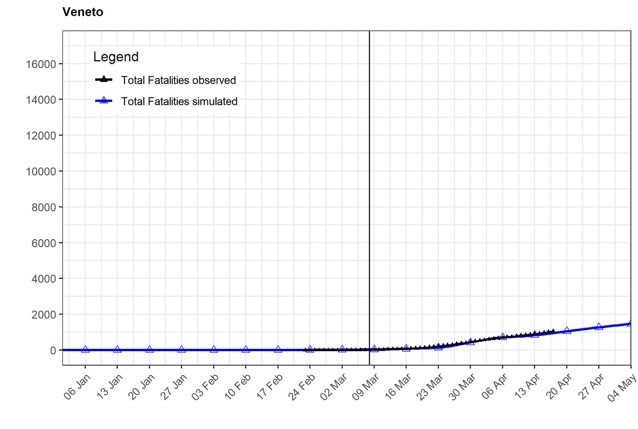
Our goal is to contrast the economic and public health effects (GDP loss vs. saved lives) of five possible policies to be implemented as of May 4, 2020 (the expected beginning of Phase 2 in Italy).
The GDP loss induced by the interaction between the pandemic and the different policies is assumed to be proportional to the number of days in which the policies are in place and to the corresponding fraction of the workforce that is unproductive.
In future research, we plan to improve on this measure in various ways, particularly with the goal of capturing more long-term economic effects of the pandemic. It is likely, however, that the measure of GDP loss we currently use is a lower bound to the total economic cost of the different policies. The number of Covid-19 fatalities associated with the different strategies is predicted by the SEIR-HC-SEC-AGE model.
The five policies that we consider are:
LOCK–Prolonged lockdown:
To continue the current lockdown, in which only a strictly needed minimum number of workers is actively employed, until the vaccine arrives or until herd immunity is reached.
SEC–Some sectors go back to work:
To allow workers of all ages to go back to work in the low-risk sector, while only the strictly needed minimum number resume activities in the high-risk sector (which include health and education workers). The rest of the population remains isolated in the current lockdown setting.
AGE–Young go back to work
To allow only young workers in the 20-49 age bracket to resume activities in all sectors, while only the strictly needed minimum number of older workers is employed in the high-risk sector. The rest of the population remains isolated in the current lockdown setting.
AGE-SEC–Young go back to work in specific sectors:
To allow young workers in the 20-49 age bracket to go back to work in the low-risk sectors, while only workers in the 20-29 age bracket are employed in the high-risk sector; the rest of the population remains isolated in the current lockdown setting.
ALL–Workers of all ages and sectors can go back to work:
To allow all active workers to go back to work independently of their age or sector. The rest of the population remains isolated in the current lockdown setting.
The trade-off between saved lives and GDP losses that characterizes “age-based” and “sector-based” strategies is not immediately obvious, and its description is our main contribution. The two extreme policies LOCK and ALL provide a useful benchmark against which to evaluate the intermediate ones.
Note that our approach is not to choose a point on the trade-off, as for example in the cost-benefit analysis approach discussed by Luigi Zingales. We limit ourselves to a description of the trade-off.
The main results are illustrated in Figure 2 and they refer to one year starting from May 4, 2020. Every point on the lines represents a strategy associated with a loss of human lives per million individuals (vertical axis) and to a GDP loss (horizontal axis).
Figure 2: The frontiers of efficient policies in Lombardy and Veneto
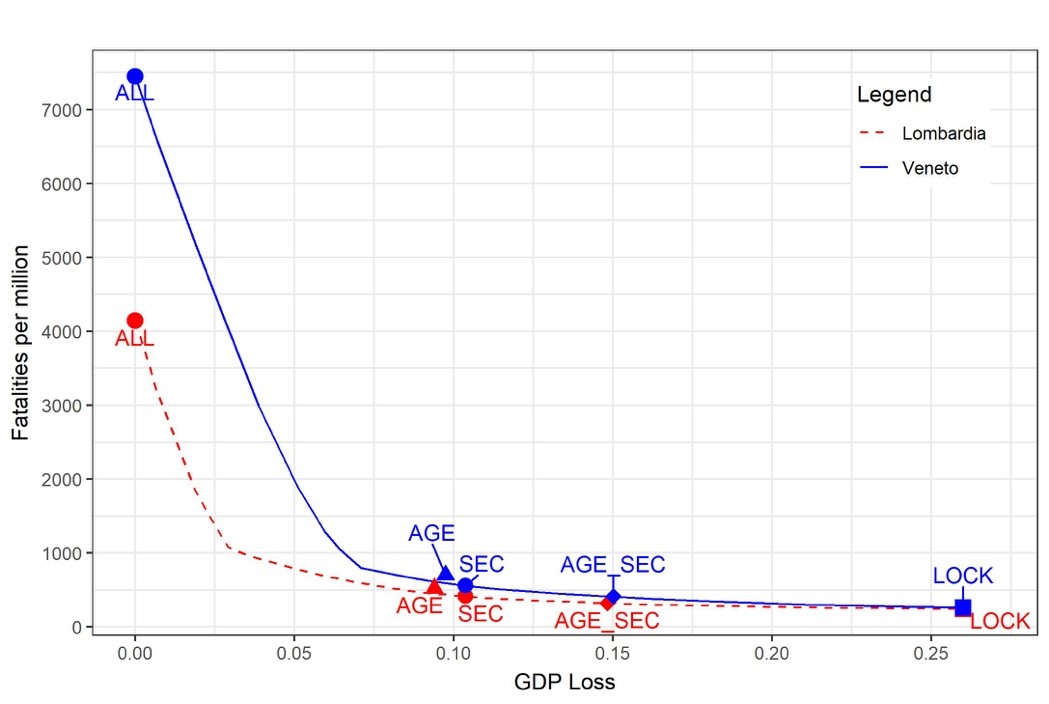
The lines describe the frontiers of efficient policies, i.e., those yielding combinations of fatalities and GDP losses that are located on the lowest south-west convex envelope of the set of outcomes induced by all feasible policies. There are no feasible strategies that could reach levels of fatalities and GDP losses below these frontiers.
The first apparently surprising result is that for given GDP loss, the minimum reachable number of fatalities is always higher in Veneto (the higher blue frontier) than in Lombardy (the lower red frontier). The reason is that Veneto has about 500 ICU beds with a population of 4.9 million, while in Lombardy there are 1500 ICU beds with a population of 10 million.
It seems like a paradox, but after having suffered so much in the initial phase of the pandemic, Lombardy will have an easier life during Phase 2, thanks to its recent investments in ICU beds.
As expected, the policy ALL, which sends all the active population back to work, avoids any GDP loss but causes the maximum number of yearly fatalities in both regions (about 40,000 in Lombardy and 36,000 in Veneto).
There exist, however, a number of efficient mixed strategies based on the age and sector criteria, that would dramatically reduce the total number of fatalities with relatively minor GDP losses until the threshold of approximately a 5-10 percent loss.
Mixed policies that cause a GDP loss of about this size are associated with about 5000 total fatalities in both regions (or less than one thousand per million).
Trying to reduce fatalities beyond this level causes a huge increase in the size of GDP losses. Prolonging the lockdown for a full year after May 4 (policy LOCK) would cause a probably-unsustainable GDP loss of almost 25 percent.
The choice which one of these specific efficient policies should be adopted depends of course on the weight society wants to give to fatalities or GDP losses in the aggregate welfare function, but our guess is that the optimal choice should fall on one of the mixed policies that produce a GDP loss of about 5 percent and a total number of fatalities equal to about one thousand per million.
It is also clear that mixed policies relying on both an AGE and SECTOR criteria offer a wider set of efficient options, as we suggested in a previous VoxEU column.
Another good news is that the average R0 parameter that corresponds to policies 1 to 4 is slightly less than 1. Only going back to pre-lockdown levels of activity (policy 5) would imply an R0 parameter greater than 1. Indeed, our simulations suggest that if we adopted this policy we would certainly face a second wave of Covid-19 infections after May 4. With all the other strategies, if we apply them carefully, it is possible to maintain R0 below 1, slowing down the diffusion of the virus.
The drawback of this result is that after one year, on May 4, 2021, we will be very far from having reached the degree of herd immunity that would free us from the virus. However, we can hope that by that time a vaccine or a cure will be available.
ProMarket is dedicated to discussing how competition tends to be subverted by special interests. The posts represent the opinions of their writers, not necessarily those of the University of Chicago, the Booth School of Business, or its faculty. For more information, please visit ProMarket Blog Policy