This research note employs the quantitative approach developed by Francesco Trebbi, Miao Ben Zhang, and Michael Simkovic (2023) to provide a descriptive overview of the main differences in costs of regulatory compliance across U.S. states for the year 2014 and over the period 2002-2014. These descriptive stylized facts can be useful in grounding extant discussion on regulatory compliance burden across different U.S. regions and over time and presents both unconditional results and results controlling for state industry composition.
Introduction
Over the past two decades, the United States has seen a troubling decline in economic growth, a trend that is not fully understood by existing economic research. This period coincides with a significant increase in the government’s role in the economy. Some government interventions have obviously been welfare-enhancing, such as stabilizing the economy during financial crises or protecting national security, while the impact of other forms of intervention are less well-understood. Take for example the expansion of government involvement manifested as increased regulation and heightened regulatory scrutiny. Indeed, the new Department of Government Efficiency (DOGE) headed by Elon Musk and Vivek Ramaswamy will aim to cut federal regulation and spending on the premise that doing so will unleash economic growth. This increased regulatory environment may be contributing to a decline in incentives for businesses to invest and innovate (for evidence, see Alesina et al. 2005; Dawson and Seater 2013; Coffey et al. 2020). The consequences could be limiting total factor productivity growth (Aghion et al. 2023) and may induce resource misallocation to compliance rather than business activities. Despite the potential impact of regulatory changes on economic performance, this area remains underexplored.
The complexity of understanding the potential impact of regulation on economic growth arises from the diverse nature of regulations, which affect various businesses in different ways over time. Consequently, measuring the aggregate impact of these regulations on the overall economy is fraught with difficulties. Current methodologies for assessing the role of regulation are insufficient, as they struggle to aggregate the effects of varying rules and mandates into a coherent evaluation of their impact on economic performance.
In new research, we provide a descriptive and quantitative examination of the regulatory burden across U.S. states using the RegIndex measure we first introduced in Trebbi, Zhang, and Simkovic (2023). RegIndex is a measure of regulatory cost affecting a business constructed as the share of the total wage bill of a firm (or establishment) spent on tasks related to regulatory compliance across all the various occupations of a firm’s workforce. RegIndex has the advantage of being a measure constructed from direct business expenditure, not imputation or projections. It can be constructed for any establishment (including very small ones) and it is designed to overcome long-standing issues of measurement and aggregation (e.g. Goff 1996) in the quantitative analysis of regulation. In addition, RegIndex does not rely on measures of cost based on statutory or regulatory text or firm announcements, which is central to an important area of this empirical literature (e.g. Davis, 2017; Al‐Ubaydli and McLaughlin 2017; Calomiris et al. 2020; Kalmenovitz 2023; Singla 2023).
It’s important to note that we do not aim to measure an optimal regulatory environment, as our measure of state regulatory compliance costs does not account for the benefits of regulation. RegIndex captures the gross costs in nature rather than the net costs. Indeed, our measure does not directly inform whether a state government regulation fails the cost-benefit analysis or not (Sunstein 2021; Cochrane 2014; OIRA (2021, 2023)).
In this article, we will outline how the measure is constructed by combining tasks associated to each occupation, as defined by the O*NET v.23 database maintained by the U.S. Department of Labor, and detailed information on occupation, employment, and wages for 1.2 million U.S. establishments obtained from the Occupational Employment and Wage Statistics (OEWS) survey over 2002-2014. The universe of occupations has over 800 detailed categories, with each entailing 22 different tasks on average from O*NET. About one-third of the occupations include at least one regulatory compliance related task. We show the robustness of the RegIndex measure across several dimensions, including extending the measure to capital expenditure related to regulatory compliance (in particular, tools and equipment following the methodology of Caunedo et al. 2023). In our paper introducing RegIndex we present several validation exercises for the measure, focusing on the responsiveness of RegIndex to various large regulatory (or deregulatory) reforms and the performance of the index relative to extant measures of regulatory cost based on other approaches (e.g. the RegData method by Al‐Ubaydli and McLaughlin 2017).
Our paper shows how RegIndex can be constructed employing a broad, medium, or conservative definition of regulatory intensity for each occupation’s task, and using different weights associated with the multiple regulatory and production activities that a task can cover. In this analysis we will focus on the most conservative and stringent RegIndex measure.
Measuring state-level RegIndex
Businesses in different states bear different regulatory compliance costs as states erect various regulatory rules and enforce regulations with a variable degree of stringency. Quantifying regulatory compliance costs across states therefore induces several challenges. First, larger states are likely to finalize more rules due to the greater number of businesses, making textual measures based on word counts or presence of conditions biased towards larger states. For instance, the RegData measure shows that the states with the greatest number of regulatory restrictions in 2023 are California, New York, New Jersey, Illinois, and Texas, and the least regulated states are Alaska, Montana, North Dakota, South Dakota, and Idaho. Indeed, state RegData and state population have a high correlation of 0.76. Second, states differ substantially in their industry composition. States with greater shares of highly regulated industries, such as oil and gas or utilities, may artificially show higher average regulatory compliance costs per business simply because of their specialization.
Using our establishment-level RegIndex data, we develop a method to extract the states’ contribution to businesses’ regulatory compliance costs, RegIndexState, that overcomes these challenges. In particular, our directly measures the average regulatory compliance costs per business in the state, ruling out the state size effect on the measure. Moreover, we construct a refined RegIndexState that controls for NAICS 6-digit fixed effects, which effectively rules out states’ industry heterogeneity in affecting the measure by partialling out industry specific variation from the index. Specifically, RegIndexState measures the cost of regulatory compliance, with higher values indicating a heavier regulatory burden on businesses within a state. Two versions of the RegIndex are considered in this note
- RegIndexState (without NAICS6 Fixed Effects): This unconditional measure provides a broader view of the overall regulatory burden without considering the specific industry makeup of each state.
- RegIndexState (with NAICS6 Fixed Effects): This conditional measure accounts for differences in industry composition across states, offering a more nuanced view of regulatory burden by controlling for the influence of industry-specific regulations.
The difference between the unconditional and conditional RegIndexState measures underscores the impact of industry composition on regulatory burden. Some states experience shifts in their rankings when the industry mix is considered, highlighting the importance of using the conditional measure for a more accurate picture.
This note further focuses on the positions of California, New York, and Texas within the regulatory landscape as salient examples, comparing their rankings and values in both the conditional and unconditional RegIndexState measures. The analysis will also highlight states with the highest and lowest regulatory burden.
Overall descriptive statistics
Table 1 reports the unconditional RegIndexState score for each state (plus the District of Columbia) and Table 2 reports the version controlling for NAICS6 industry fixed effects for the year 2014, the final year of the sample considered. The top 5 highest regulatory burden states in Table 1 are District of Columbia, Delaware, Connecticut, Vermont, and Alaska and the lowest 5 states in terms of regulatory compliance costs are Nevada, South Dakota, Florida, Mississippi, and Alabama. When looking at the RegIndexState conditional on industry fixed effects in Table 2, the top 5 highest regulatory burden states in Table 2 are District of Columbia, Vermont, Connecticut, Delaware, and Massachusetts and the lowest 5 states in terms of regulatory costs are Alabama, Louisiana, North Dakota, Mississippi, and North Carolina.
TABLE 1: Unconditional State RegIndex in 2014
This table lists the unconditional RegIndexState of states from the highest to the lowest as of 2014. The unconditional RegIndexState are estimated from the following regression using over 1 million establishments in the OEWS 2014 May data.

| State | RegIndexState (Unconditional) |
| District of Columbia | 2.322 |
| Delaware | 1.902 |
| Connecticut | 1.870 |
| Vermont | 1.861 |
| Alaska | 1.819 |
| Massachusetts | 1.777 |
| New Mexico | 1.707 |
| New York | 1.701 |
| Oklahoma | 1.667 |
| Minnesota | 1.659 |
| California | 1.643 |
| Wyoming | 1.642 |
| Washington | 1.635 |
| Kansas | 1.614 |
| New Jersey | 1.612 |
| Arizona | 1.609 |
| Pennsylvania | 1.609 |
| Virginia | 1.588 |
| Maryland | 1.583 |
| Nebraska | 1.571 |
| Texas | 1.569 |
| Hawaii | 1.568 |
| South Carolina | 1.567 |
| Colorado | 1.562 |
| Oregon | 1.560 |
| Idaho | 1.552 |
| Tennessee | 1.545 |
| Indiana | 1.538 |
| Louisiana | 1.527 |
| Utah | 1.526 |
| Wisconsin | 1.523 |
| Illinois | 1.522 |
| Ohio | 1.521 |
| Rhode Island | 1.518 |
| Missouri | 1.517 |
| Michigan | 1.514 |
| North Carolina | 1.508 |
| Iowa | 1.492 |
| Maine | 1.478 |
| Kentucky | 1.470 |
| Montana | 1.463 |
| North Dakota | 1.460 |
| West Virginia | 1.451 |
| New Hampshire | 1.450 |
| Georgia | 1.449 |
| Arkansas | 1.439 |
| Alabama | 1.432 |
| Mississippi | 1.411 |
| Florida | 1.399 |
| South Dakota | 1.387 |
| Nevada | 1.372 |
TABLE 2: Conditional State RegIndex in 2014
This table lists the conditional RegIndexState of states from the highest to the lowest as of 2014. The conditional RegIndexState are estimated from the following regression using over 1 million establishments in the OEWS 2014 May data.

| State | RegIndexState (Conditional) |
| District of Columbia | 2.174 |
| Vermont | 1.900 |
| Connecticut | 1.790 |
| Delaware | 1.785 |
| Massachusetts | 1.733 |
| Oklahoma | 1.676 |
| New York | 1.674 |
| Alaska | 1.674 |
| Hawaii | 1.666 |
| Nebraska | 1.649 |
| Tennessee | 1.633 |
| Minnesota | 1.631 |
| Arizona | 1.631 |
| California | 1.622 |
| New Mexico | 1.608 |
| Maine | 1.602 |
| Idaho | 1.599 |
| Pennsylvania | 1.597 |
| New Jersey | 1.594 |
| South Carolina | 1.584 |
| Montana | 1.577 |
| Washington | 1.575 |
| Indiana | 1.574 |
| Kansas | 1.574 |
| Virginia | 1.571 |
| Oregon | 1.567 |
| Rhode Island | 1.563 |
| Maryland | 1.546 |
| Ohio | 1.544 |
| Kentucky | 1.542 |
| Wisconsin | 1.539 |
| South Dakota | 1.537 |
| Missouri | 1.537 |
| Iowa | 1.536 |
| Utah | 1.535 |
| Florida | 1.533 |
| Texas | 1.532 |
| Nevada | 1.529 |
| Georgia | 1.526 |
| New Hampshire | 1.523 |
| Colorado | 1.521 |
| Wyoming | 1.520 |
| Illinois | 1.512 |
| Arkansas | 1.508 |
| West Virginia | 1.505 |
| Michigan | 1.499 |
| North Carolina | 1.498 |
| Mississippi | 1.490 |
| North Dakota | 1.490 |
| Louisiana | 1.444 |
| Alabama | 1.413 |
The average regulatory burden across states is similar in both the conditional and unconditional measures, as indicated by the comparable mean values, around 1.58-1.59 percent of the total wage bill of an establishment on average, using the most conservative figure of Trebbi et al. (2023). The unconditional has a higher standard deviation (0.16) than the conditional RegIndexState (0.12), suggesting greater variability in regulatory burden when industry composition is not considered. The minimum and maximum values for the unconditional RegIndexState (1.37 to 2.32 percent of the total wage bill of an establishment) and the conditional RegIndexState (1.41 to 2.17) illustrate the range of regulatory burdens across states.
Analyzing the data by state reveals some geographic clustering, as can be observed in Figure 1. The Figure reports a map of the conditional RegIndexState in 2014 and highlights how the highest regulatory burdens are concentrated in the Northeast (Connecticut, Delaware, District of Columbia, Massachusetts, Vermont), indicating stricter regulatory environments in this region. States in the South (Alabama, Mississippi, Louisiana) and Midwest (North and South Dakota) generally have lower regulatory burdens (conditional RegIndex), suggesting a more business-friendly environment.
FIGURE 1: Heatmap of Conditional State RegIndex in 2014
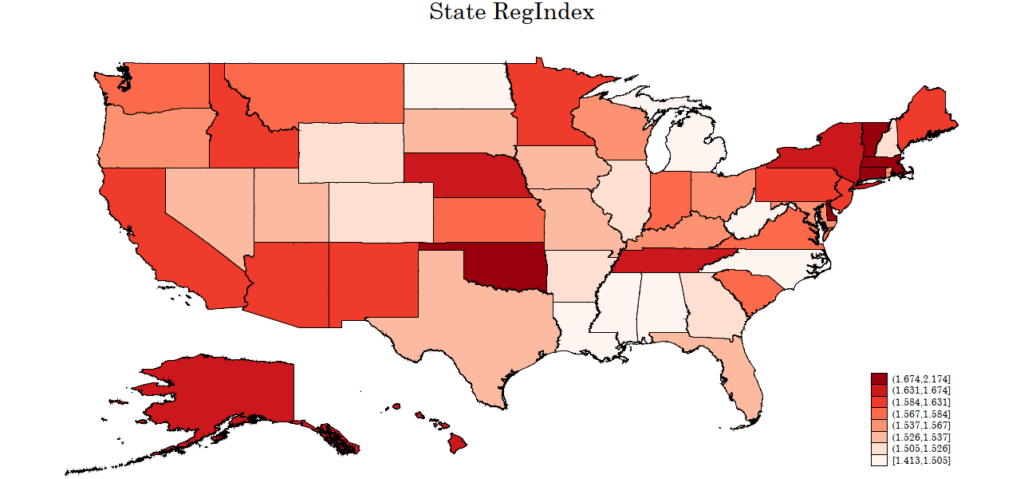
Finally, our RegIndexState does not suffer from a state size effect. For example, our conditional RegIndexState in 2014 has a low correlation of -0.12 with state population in 2014.
Changes over time
It is also important to highlight that the extent of the regulatory compliance costs varies over time. Indeed, scholars of regulation have emphasized how, even over a relatively short period of time, regulatory frameworks may substantially change and deteriorate (see, for instance, Gutiérrez and Philippon 2017). For this reason, changes in the conditional RegIndex over the sample period studied in our paper can be informative.
Figures 2a and 2b report two maps focused on the changes in RegIndexState level, one for 2002-2014 period and the other for 2005-2014 period, with the map reporting 2005-2014 changes being our preferred descriptive evidence for the following reason. In 2002 the BLS changed their OEWS survey design (for example in terms of occupation codes). Hence, 2002-2004 panels (all OEWS panels are based on a backward-looking set of 6 bi-yearly survey results) rely on cross-walking the pre-2002 occupation codes to the post-2002 occupation codes, resulting in measurement error. For this reason (and a common practice when it comes to using the OEWS panels) researchers usually perform longitudinal analysis starting with the 20052 panel, as it is unaffected by the noise arising from cross-walking occupations.
FIGURE 2: heatmap of Changes in Conditional State RegIndex
2a. Changes from 2002-2014
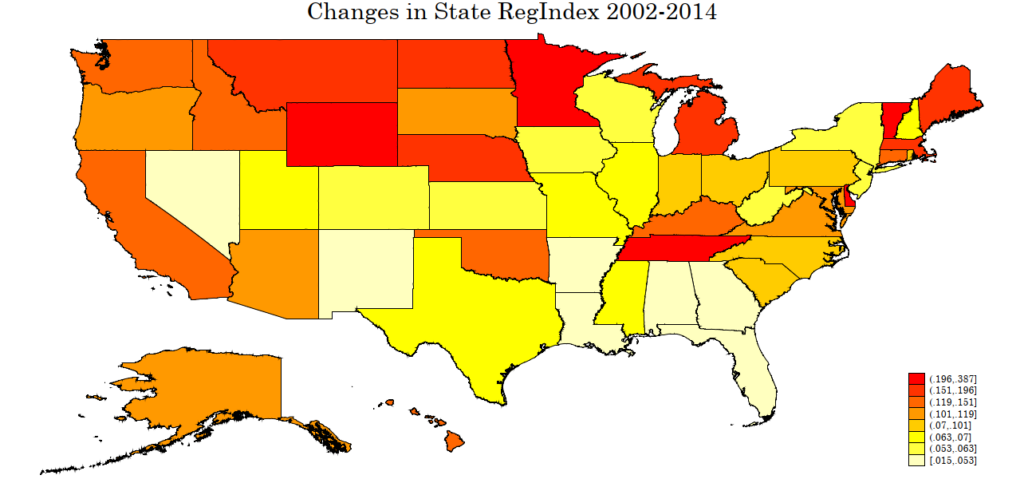
2b. Changes from 2005-2014
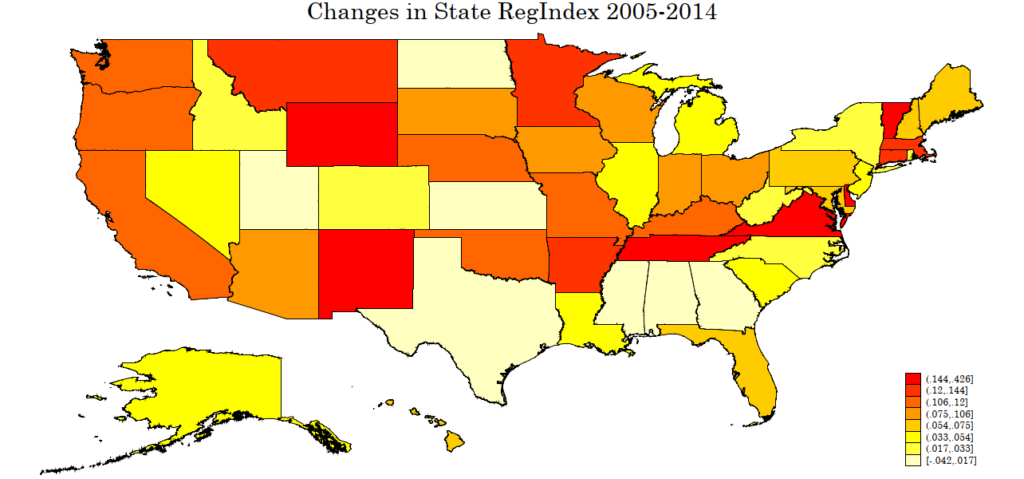
The conditional regulatory compliance cost index increases in most states between 2005 and 2014, indicating that during this time period the regulatory burden on firms as a share of their wage bill grew. Such increases appear however mild, on average +0.086 over a ten year period, or less than 1 percent increase per year (about half of the Real GDP per capita growth in the United States over the same period).
States that saw the largest increase in regulatory compliance costs between 2005 and 2014 include Vermont (+0.43), New Mexico (+0.25), Delaware (+0.20), Tennessee (+0.18), and Wyoming (+0.17). The states that saw the mildest increase in regulatory compliance costs between 2005 and 2014 are Mississippi (-0.04), Georgia (-0.03), Alabama (0), Texas (0), and Kansas (+0.01).
The variability in the index across states remains relatively constant over time, as shown by the similar range of the index in 2005 and 2014. The range of the regulatory compliance cost index across states in 2005 was approximately 1.35 to 2.04, while in 2014 it was 1.41 to 2.17.
Salient examples
For the sake of showcasing the descriptive capabilities of our index, we focus now on three salient examples which display very different dynamics over the time period of our analysis.
California
California ranked 14th in terms of the conditional RegIndexState, with a value of 1.62 in 2014. This places California in the upper half of states regarding regulatory burden, implying a relatively stricter regulatory environment compared to the national average. In terms of the unconditional RegIndex, California ranked 11th, with a value of 1.64. This indicates that when industry composition is not considered, California’s regulatory burden remains relatively high, suggesting that the state’s overall regulatory environment is stricter regardless of industry-specific regulations. The change in the conditional regulatory compliance cost index between 2005 and 2014 for California was +0.11, above the national average of +0.086.
New York
New York ranked 7th in terms of the conditional RegIndexState, with a value of 1.67 in 2014. This places New York among the states with the highest regulatory burdens, even when industry composition is considered. In terms of the unconditional RegIndexState, New York ranked 8th in 2014, with a value of 1.70. This consistently high ranking suggests that New York’s regulatory environment is generally stricter across industries, contributing to its high overall regulatory burden. However, the change in the conditional regulatory compliance cost index between 2005 and 2014 for New York was a low +0.03, well below national average and a quarter of the size of the increase in California over the same time period.
Texas
Texas ranked 37th in terms of the conditional RegIndexState in 2014, with a value of 1.53. This places Texas in the lower half of states regarding regulatory burden, implying a relatively business-friendly environment compared to the national average. In terms of the unconditional RegIndexState, Texas ranked 21st, with a value of 1.57. This indicates that when industry composition is not considered, Texas’ regulatory burden appears higher. This difference could be attributed to the state’s significant concentration in industries with heavy regulatory settings, such as oil and gas and healthcare. The change in the conditional regulatory compliance cost index between 2005 and 2014 for Texas is very close to zero, even lower than the limited increase observed in New York, and much lower than the national average increase over the same period and, a fortiori, the change experienced by the state of California.
Discussion and caveats
Understanding the costs and benefits of the regulatory landscape is crucial for businesses and policymakers and extant research has shown that the level of regulation, supervision and enforcement can differ substantially across states (e.g. Agarwal et al. 2014). RegIndexState, provides valuable insights into the compliance costs across states and shows dispersion in the incidence of regulatory compliance costs. By accounting for industry heterogeneity, in particular, the conditional RegIndexState offers a more precise tool for assessing regulatory burden.
The data employed in this note does not include information on the specific regulations driving the differences in regulatory burdens across states and offers an aggregate perspective on the determinants of costs. Further future analysis could explore these regulations and their economic impact.
RegIndexState provides an imperfect, but useful and intuitive benchmark for the relative difference in average firm’s compliance costs across states. For instance, a difference of 0.223 in RegIndexState between California and Florida (1.622-1.399) indicates that a business operating in California spends 0.223% of its total labor costs on regulatory compliance compared to business in the same industry operated in Florida. Our measure, however, cannot establish whether California has an optimal regulatory environment, while Florida is too lax, or vice versa – an important limitation.
RegIndexState cannot distinguish whether the difference is due to the state government in California imposing more regulations than Florida, or due to regulatory agencies in California enforcing regulations with greater stringency than in Florida. Future studies can aim to separate these two channels, for instance, using the instrumental variable approach we proposed.
Overall, quantitative and systematic analyses of regulatory costs (and benefits) in the aggregate, (that is beyond the specificity of a single rule) are all too rare. A simple application like ours is a partial and incomplete attempt, but at least it has the ambition of taking a macro perspective to the regulatory system in its entirety. Crucially, without such a macro-level understanding, large-scale regulatory reforms risk being implemented without sufficient information, potentially leading to unintended consequences.
Author Disclosure: Francesco Trebbi acknowledges support from the Smith Richardson Foundation grant #2022-2935. Read ProMarket’s disclosure policy here.
Articles represent the opinions of their writers, not necessarily those of the University of Chicago, the Booth School of Business, or its faculty.


