

There are different ways of determining who should be considered middle-class. But there is one thing they have in common: all reveal that the middle class in America is shrinking.
Chances are that you believe you are in the middle class—nearly everyone in the United States does. Doctors and lawyers believe they are middle-class; so, too, do welders and waiters. In a 2015 Pew survey, only 10 percent of Americans said they considered themselves lower class and just 1 percent thought they were upper class.
Earnings have been flat or stagnant for many middle-class workers in the United States while health care, education, and housing costs are rising. Surveys show that Americans accurately perceive these pressures too and share a broad belief that the middle class is struggling. Seven in ten respondents to a Northwestern Mutual survey said that the middle class was staying the same or shrinking. One-third said the middle class might disappear entirely.
Surveying individuals about class status is one of the common ways that researchers can learn about who considers themselves middle class, where they fall within the middle class, and why they consider themselves middle class. There are two other primary strategies: Focus on the share of total income earned by the middle 60 percent, or define “middle class” with upper and lower income limits and see who falls in that zone.
As we explore in our recent research, each of these methods have their limitations, but each also reveals a different facet of the decline of America’s middle class: either the shrinking membership in the middle class or the reduction in aggregate middle class income.
Survey Says: The Middle Class Knows It Is Struggling
The most straightforward way to find out who is middle class is to just ask them. One weakness of population surveys, however, is that how people define middle class varies. For many Americans, the term evokes specific attributes, such as thriftiness and dedication to work. Others define it in relation to income; in the minds of many, those in the middle class are likely to have some retirement savings, own a house, and send their children to college.
Yet even as large majorities call themselves middle-class, they also believe that the middle class is segmented. Significant numbers of respondents say they are either “lower middle-class” or “upper middle-class.” This suggests that people believe the middle class is much broader than most researchers would demarcate it. If the lower and upper middle-class people are reclassified into the lower and upper classes respectively, as Pew rearchers did in 2012, that yields a much more sensible assessment. As shown in Figure 1, with that adjustment, just shy of 50 percent of the population would be truly middle class. (Notably, Black and Latinx respondents were far less likely than White respondents to identify themselves as belonging to the middle and upper classes, a topic that deserves further attention.)
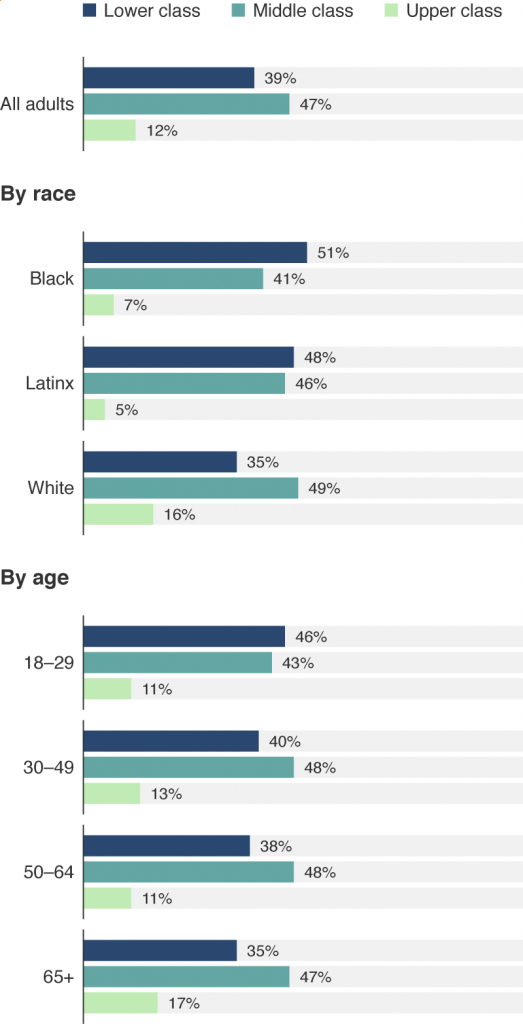
Figure 1: Proportions of Self-Reporting Membership in Lower, Middle,
And Upper Classes, by Race and Age. Source: Pew Social and Demographic Trends, 2015.
Note: “Don’t know” was also a response option (not presented). Numbers might not add to 100 because of rounding.
Getting a Smaller Slice of the Income Pie
The second common way of defining who is middle class divides the population, typically into quintiles, and examines the share of the nation’s total income taken home by the middle group (in our case, the second, third, and fourth quintiles).
US Census data (Figure 2) reveals how much income—including investment income and earnings—the middle 60 percent took home over time. From 1967 through 1987, it exceeded one-half of the country’s income. By 2019, that share had fallen to 45 percent.
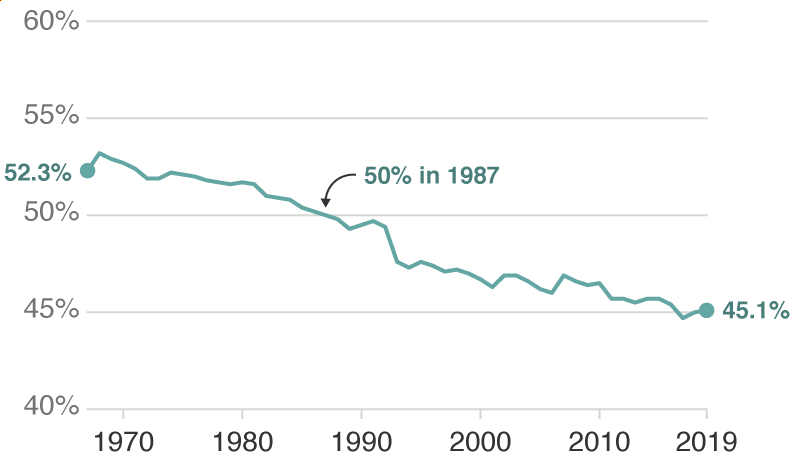
Figure 2. Share of Total Income Accruing to Middle 60 Percent, 1967–2019. Source: US Census Bureau, 2020.
One problem with this approach is that it always measures the same share of the population. So it can determine if these middle earners are getting richer or poorer, but not whether the middle class is shrinking or growing.
Further, demographics obscure even larger declines in the welfare of the middle class. Earnings generally increase as workers age, peaking soon after age 40. By 1980, the US labor force is composed of many young, lower-earning, baby boomers (with a median age of 34.6 years in 1980 as compared to over 40.6 years old in 2010), making the 52 percent share through the late 1970s even more remarkable. In contrast, today’s labor force is, on average, much older, leading us to expect the typical worker to have attained a higher wage. Instead, even while baby boomers were at their peak earning stage, middle-class incomes fell overall.
Furthermore, the proportion of each generation in a middle-class household has fallen (see Figure 3). When baby boomers were in their 20s, 59 percent of them lived in middle-class households. By the time millennials were in their 20s, only 53 percent did.
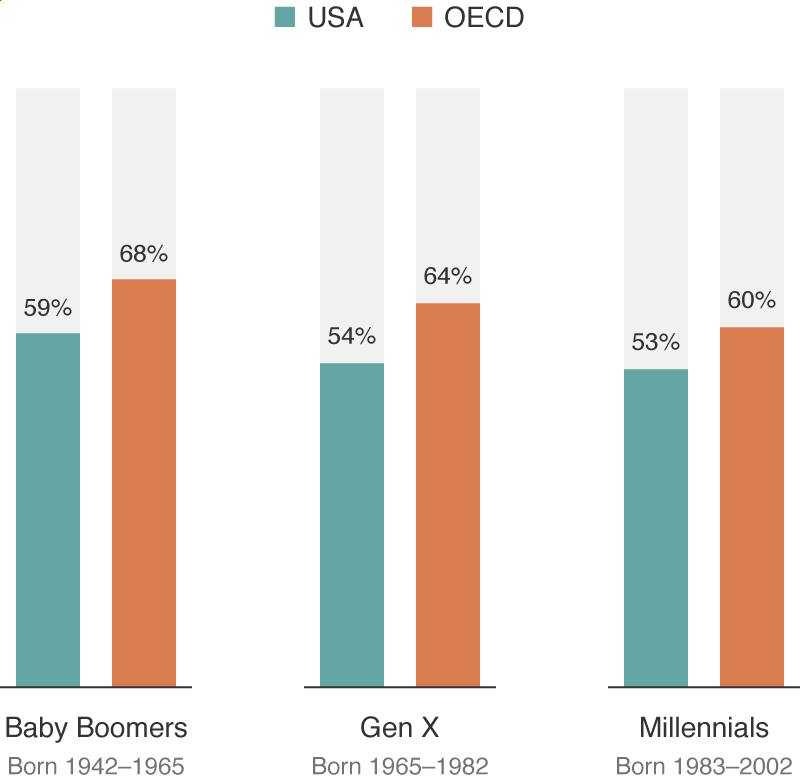
Figure 3: Percentage of Population in Their 20s in Middle-Class Households, by Generation. Source: OECD, 2019. Note: Calculation based only on those ages 20 to 29 years old
As the Middle Class Shrinks, Where Are They Going?
To assess changes in the number of people in the middle class over time, we need yet a third method: set fixed income thresholds for who qualifies.
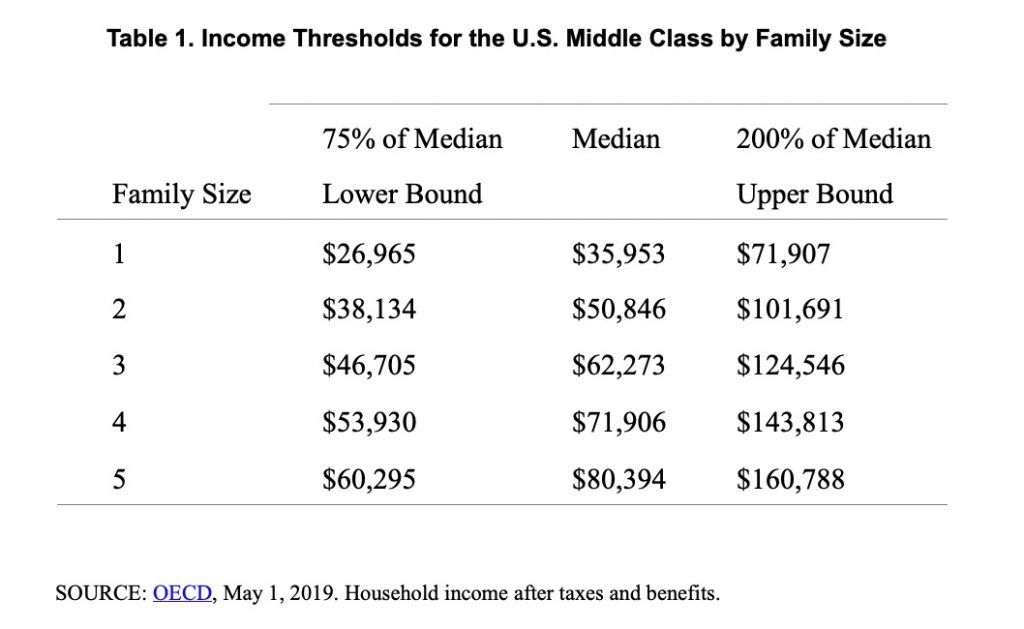
The lower threshold is commonly some proportion of the median household income, although researchers disagree about where it is best set. For our work, we use a fairly high bottom threshold of 75 percent of the U.S. median income. By that definition, a household in 2019 would have to earn at least $51,527 to be considered middle-class. (The median US household income was $68,703 that year.) Below that threshold, we view individuals and households as aspiring to the middle class but having not attained it. As we discuss below, best practice is to adjust income for taxes and benefits to better assess the household budget.
Other researchers use two-thirds or 60 percent of the median household income. Lower thresholds like these can be problematic as they start to interact with means-tested government programs that raise income. What the upper limit should be is also debatable. We have opted for an upper bound of 200 percent of the median, or $137,406 in 2019.
Why focus exclusively on income instead of some combination of earnings, wealth, education, and/or some other social and cultural capital? Unfortunately measuring those other attributes is challenging; weighting them and interpreting them is even more intractable. Consequently, many analysts stay focused on income, and to enable cross-nation comparisons, on disposable income.
Bookending the income levels of the middle class at 75 percent and 200 percent of the median income (see Table 1), approximately 51 percent of the United States falls in the middle class—strikingly close to the adjusted 2012 Pew survey.
The advantage of measuring the middle class this way is that we can measure changes in the number of people and households in that group. From 2007 to 2017, the middle class shrank by about 2.7 percent, with about 1.9 percent moving to the upper class and about 0.8 percent falling into the lower class. For the 0.8 percent who fell into the lower class—about 2.6 million Americans—it is increasingly likely that they and their children will remain lower class due to increasing social rigidity.
“The Covid-19 pandemic is likely to further accelerate these trends.”
Who Will Be Middle-Class After the Pandemic?
Each of these ways of systematically measuring the US middle class reveals decline: Fewer millennials are middle-class than Gen Xers or baby boomers were at the same age. Middle-class workers are earning a national income share that is 8.5 percentage points lower, which translates to a 16.0 percent reduction. And the middle class is shrinking.
The Covid-19 pandemic is likely to further accelerate these trends. Workers in the service sector, unable to work remotely, were disproportionately displaced from their jobs. Other employment disruptions led firms to automate more jobs. The increased costs and risks of interpersonal contact could speed firms’ adoption of robotics, payment machines, and other labor-saving technology. Efforts by the US government to support workers and businesses will help prevent families from falling into poverty, but the massive restructuring of the economy resulting from the pandemic will likely generate further declines in the middle class and a disproportionate entry into the lower class.
Jeffrey Wenger is a senior policy researcher at the nonprofit, nonpartisan RAND Corporation. Melanie Zaber is an associate economist at RAND. They are authors of the recent RAND paper “Who is Middle Class?” Their research was funded by the RAND Lowy Family Middle-Class Pathways Center.