

A new book, The Power of Creative Destruction, explores how lobbying contributes to the increase in the top 1 percent’s share of income. An excerpt.
If the increase in income going to the top 1 percent derives not from innovation but rather from the construction of new barriers to entry by incumbent firms, it will not necessarily have positive effects. By impeding the entry of new innovators, entry barriers block the process of creative destruction. As a consequence, they may also reduce social mobility. Finally, insofar as entry barriers increase the share going to the top 1 percent and reduce social mobility, it is highly probable that they also lead to an increase in overall inequality.
We can contrast Steve Jobs, cofounder of Apple, who exemplifies building a fortune through innovation, with Carlos Slim, a Mexican businessman with close ties to political power. Slim made a large fortune in the early 1990s from the privatization of the state telecommunications operator Teléfonos de México (Telmex) and its transformation into a private monopoly. Slim benefited from the fact that the telecommunications sector was subject to little regulation and in particular was exempt from regulation by Mexico’s Federal Economic Competition Commission.
The Effects of Lobbying on Growth and Inequality
Incumbents rely heavily on lobbying to protect their rents by limiting the entry of new firms. Initially, the term “lobby” referred to the lobbies or antechambers of the British House of Commons, where in the nineteenth century representatives of various interest groups came to interact with parliamentarians. According to the Gallup annual survey of Honesty and Ethics in the Professions for 2017, 58 percent of Americans rated the ethical standards of lobbyists as “low” or “very low,” compared to 21 percent for bankers.
Who engages in lobbying, and how extensive is it? In the United States, lobbying represents approximately 3 billion dollars each year, whereas lobbying in the European institutions accounts for 1.14 billion euros per year. As Konstantinos Dellis and David Sondermann showed, the largest firms as measured by sales (turnover) are those that utilize lobbying the most intensively. Furthermore, the firms that spend more on lobbying are less productive and have higher profit margins than other firms. Finally, firms in highly competitive sectors spend more on lobbying than firms in less competitive sectors.
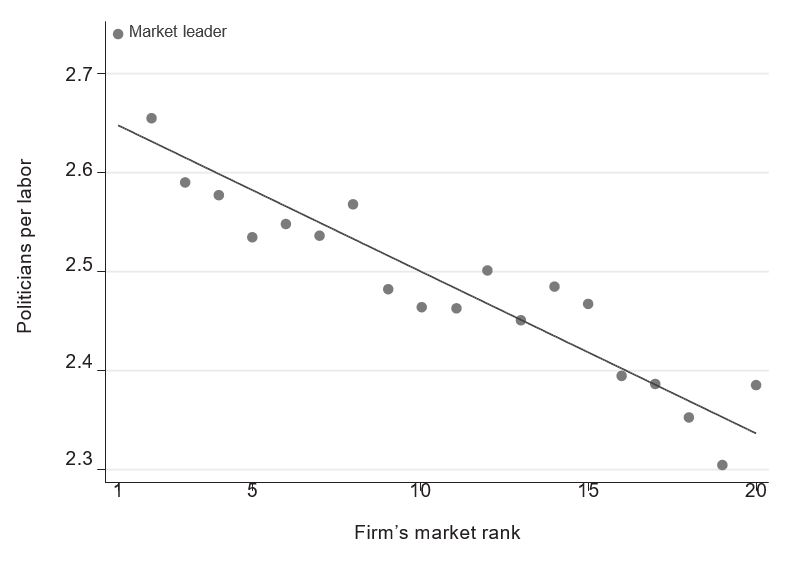
A study based on Italian data by Ufuk Akcigit, Salomé Baslandze, and Francesca Lotti again revealed the connections between firms and politicians. As Figure 5.10 shows, the larger a firm’s market share—the farther left it is on the graph—the greater the fraction of its employees who also hold political office at the local, regional, or national level.
The following question naturally comes to mind: do lobbies provide useful and enriching expertise to political decision makers, or do they merely exercise pressure to prevent the entrance of new competitors on the market? Using the public archives of the US Senate and the Federal Election Commission, a study by Marianne Bertrand, Matilde Bombardini, and Francesco Trebbi identified lobbyists active in the United States between 1999 and 2008, and tallied the amount of their gifts to electoral campaigns. The authors looked in particular at the individual profiles of these lobbyists in order to determine if they were “specialized” or “connected.” According to their terminology, a “specialized” lobbyist is one who concentrates his assignments on a limited number of fields, from which one can infer that the lobbyist has real expertise in those fields. A lobbyist is “connected” if he has privileged access to a political decision maker, either because they belong to the same party or because the lobbyist has contributed to one or more of the politician’s electoral campaigns.
The authors showed that the share of connected lobbyists increased during the period from 1998 to 2008. Furthermore, in 2008, more than three-quarters of the lobbyists were not specialized, nearly 54 percent were clearly connected, and less than one out of seven lobbyists was specialized without being connected. Finally, the authors showed that lobbyists who were connected to GOP politicians earned on average 25 percent more than other lobbyists when the Republicans controlled the White House and the Senate, that is, between 2002 and 2007. Overall, even if some lobbyists are specialized and contribute information that is potentially useful to society, this study underscored that a large majority of them are politically connected and not specialized. In addition, even if lobbyists receive a financial premium from specialization, this premium is smaller than the premium from being connected.
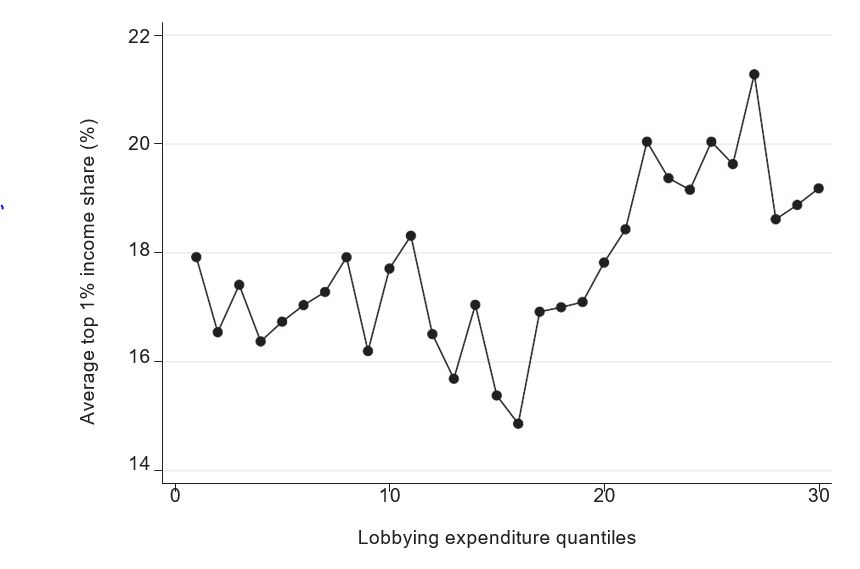
What is the impact of lobbying, which we now know is for the most part connected, on inequality? Figure 5.11 depicts the relationship between the top 1 percent’s share of income and the intensity of lobbying in the various American states during the period 1998 to 2008. We can see that the share of the top 1 percent increases sharply when lobbying becomes sufficiently intense. This outcome confirms that lobbying is indeed another source, distinct from innovation, of inequality at the top.
It is not at all surprising that lobbying contributes to the increase in the top 1 percent’s share of income. Connected lobbyists enable incumbent firms to maintain their market power and thus their rents. In particular, lobbying helps incumbents not only to protect their sector from competition by instituting customs tariffs, but also to win procurement contracts, to have easier access to bank credit, to pay less tax, and to obtain more public subsidies.
The impact of lobbying on corporate taxes is particularly interesting. We can demonstrate that firms that engage in lobbying pay less tax, especially those with the highest levels of debt, have greater capital intensity, and report greater R&D spending. Lobbying enables these firms to obtain tax credits on their R&D expenditures and more favorable tax depreciation schedules for certain types of equipment.
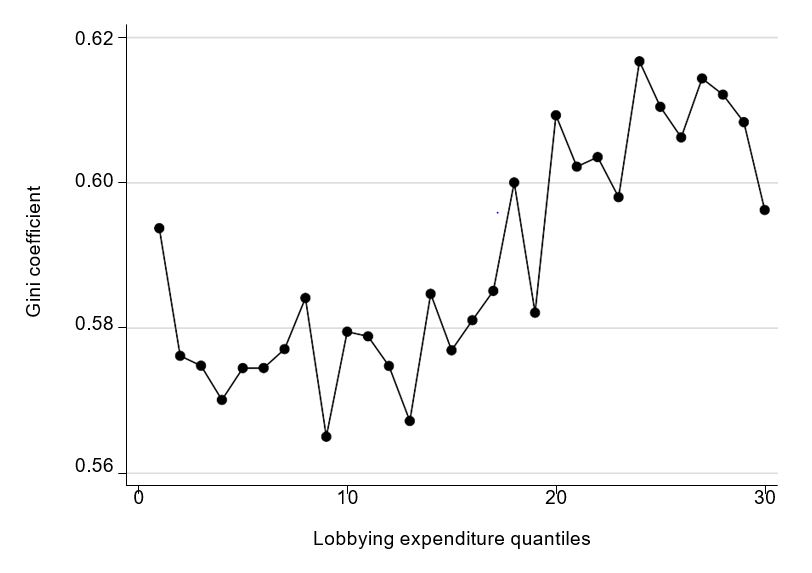
Figure 5.12, which derives from the same data, shows that overall income inequality, as measured by the Gini coefficient, in an American state varies with the intensity of lobbying in that state. Overall inequality increases sharply when lobbying becomes sufficiently intense. This situation contrasts with the effect—or rather the absence of effect—of innovation on overall inequality. This is precisely the result we would expect: insofar as lobbying is mainly connected, it prevents the entry of new firms into the market, thereby reducing social mobility and at the same time increasing top income inequality. In contrast, innovation enhances social mobility, which is why it has no significant impact on overall inequality.
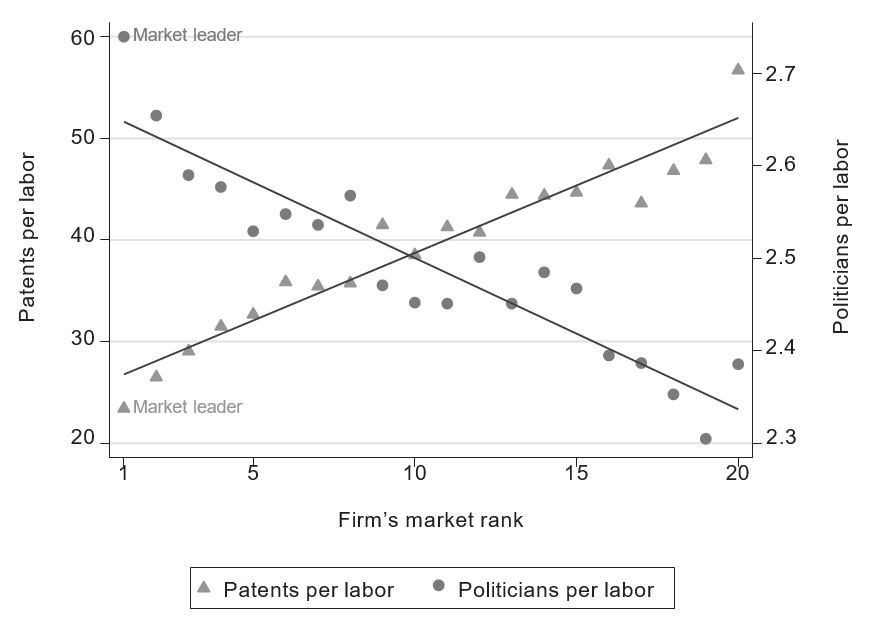
We now turn to the impact of lobbying on innovation and growth. Figure 5.13 supplements Figure 5.10 with a curve showing the intensity of innovation in the firm as a function of the firm’s sales. The higher the firm’s sales, the lower its innovation intensity. This figure strongly suggests that as a firm gains greater market power and moves toward market dominance, it focuses its efforts less and less on innovation and more and more on political connections and lobbying.
The same study shows that the rate of productivity growth of Italian firms is negatively correlated with their investment in political connections. In contrast, employment growth is positively correlated with that investment. The explanation is that political connections help these firms save on red tape, but at the expense of innovation, which constitutes the primary source of productivity growth.
Overall, investing in lobbying is bad for growth for two reasons: first, as incumbent firms grow, they invest more and more in lobbying at the expense of innovation, and second, collusion between firms and politicians increases the costs of entry into the market and therefore discourages creative destruction. The higher the proportion of politically connected firms in an industry, the less dynamic the industry is: fewer firms enter the market, fewer existing firms exit, and the average age of firms is higher.
“Yesterday’s innovators often become today’s entrenched incumbents. As they grow, they invest increasingly more resources in lobbying and political connections, at the expense of innovation.”
What have we learned from analysis thus far? Our first conclusion is that, although innovation may be a source of top income inequality, it nevertheless has virtues that do not accompany other sources of inequality, such as lobbying and the resulting barriers to entry. First, innovation is a source of productivity growth and business dynamism, which is not true of political connections. Second, innovation, especially by new entrants, is positively correlated with social mobility, whereas lobbying reduces entry and therefore reduces social mobility. Finally, innovation does not seem to be correlated with overall inequality, whereas lobbying aggravates overall inequality. Therefore, if our goal is to reduce top income inequality, we must not treat all sources of top income inequality the same. In particular, we should not treat innovators in the same way we treat politically connected incumbent individuals or firms. Tackling top income inequality in a way that discourages innovation amounts to shooting ourselves in the foot by reducing social mobility with the likelihood of aggravating overall inequality at the same time we reduce growth.
The second conclusion is that we must nonetheless concern ourselves with the wealthy, including those who became wealthy through innovation, because yesterday’s innovators often become today’s entrenched incumbents. As they grow, they invest increasingly more resources in lobbying and political connections, at the expense of innovation. How then can we both reward innovation and prevent yesterday’s innovators from using their innovation rents to prevent the entry of competitors? How can we encourage the emergence of new innovators like Steve Jobs while minimizing the likelihood that they will later resemble Carlos Slim? Is it sufficient to rely on taxation tools and to impose higher taxes on capital, or must we find different ways to tax and use other tools?
Excerpted from The Power of Creative Destruction: Economic Upheaval and the Wealth of Nations by Philippe Aghion, Céline Antonin, and Simon Bunel, translated by Jodie Cohen-Tanugi, published by The Belknap Press of Harvard University Press. Copyright © 2021 by the President and Fellows of Harvard College. Used by permission. All rights reserved.