

A new study measures factors associated with the adoption of social distancing across America and finds that widespread adoption of social distancing measures is correlated with higher incomes, political affiliation, and social capital.
The Covid-19 pandemic has revealed differences in the readiness of Americans to adopt public health measures. In a new study, we track movements and behaviors using aggregated daily location pings from approximately 20 million smartphones in the United States. This data allows us to anonymously measure factors associated with the adoption of social distancing.
Social distancing is effective in limiting the spread of the virus but remains costly to adopt, because measures like staying at home and avoiding crowds need to be widely adopted to provide collective benefits. By restricting their mobility, citizens are being asked to take actions for the common interest without necessarily seeing direct benefits for themselves. Economic analyses of collective action problems have stressed the potential for free-riding when individual action creates a public benefit at a private cost. Therefore, compliance with social distancing is likely to be linked not only to individual health circumstances, but also to pro-social motives and norms of cooperation.
Research on prosocial behaviors predicts that compliance with social distancing can be affected by our perception of others. If social distancing is interpreted as an act of altruism, individuals are motivated by benefits that their actions afford to others. But social distancing could also be motivated by reciprocity, whereby an individual is willing to act charitably to acknowledge sacrifices made by others, or, conversely, punish anti-social actions of others even when such actions are costly.
In addition to norms, we expect the material cost of staying at home to impact adoption of social distancing. Economic conditions may affect the cost and disruption caused by working from home and respecting social distancing. So compliance with social distancing is likely to vary with economic status.
Measuring Social Distancing
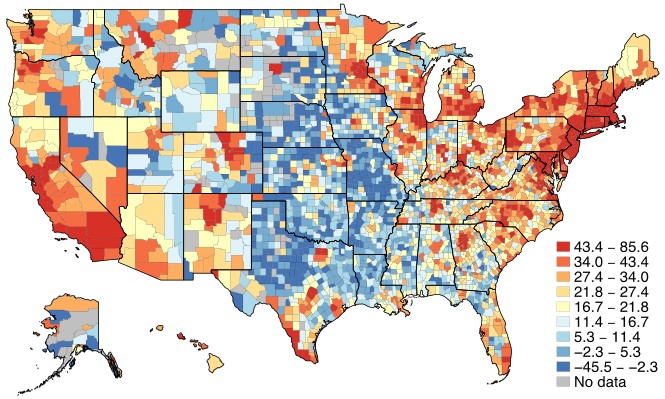
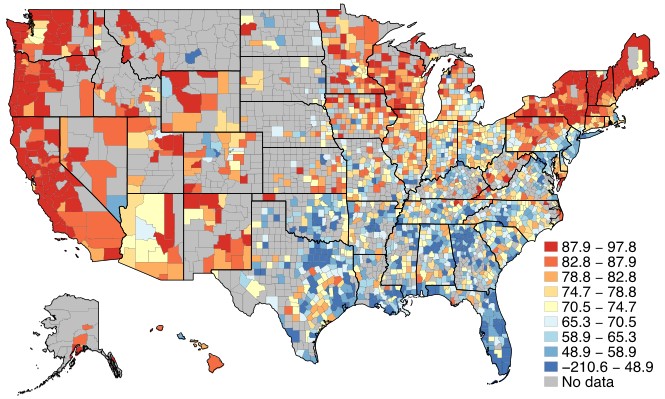
We use daily movement information from anonymized cellphone data aggregated by county to measure social distancing. We rely on two distinct measures: (i) change in the time spent at home (ii) the degree of exposure to other cellphone users in public places. This captures the dual recommendation of staying at home and avoiding crowded places. Our social distancing index is constructed as a weighted average of these two measures through a principal component analysis. First, the fraction of cellphone users leaving using the Mobility and Engagement index. Second, the level of exposure to other cellphone users at commercial venues from Couture et al. (2021). We then express this index as a percentage change compared to a baseline value in January-February 2020.
As expected, there are large differences in the adoption of social distancing across US counties. As shown in Figures 1 and 2 for the two dimensions of social distancing, counties in New England or California are seeing very high levels of social distancing (81 percent reduction in San Mateo County, CA or 86 percent reduction in Morris county, NJ as of January 13, 2021), while counties in Texas, Oklahoma, or Iowa were seeing people spend more time outside compared to pre-pandemic levels.
Differences in Compliance With Social Distancing
To understand differences in the adoption of social distancing, we look for patterns in the data based on variation in political, economic, and social characteristics of counties. We also account for demographic composition, severity of infections, and timing of state interventions to allow for comparability in levels of social distancing between counties.
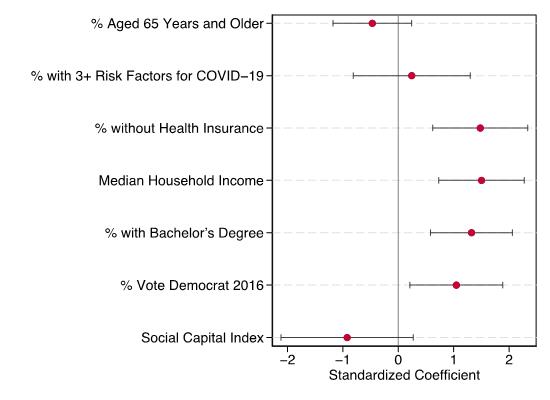
Figure 3 shows the results. Several characteristics are significantly associated with more social distancing. First, counties with vulnerable populations have higher levels of social distancing on average. Counties with a 1 standard deviation increase in the fraction of population 65 years or older (corresponding to an increase of 4.5 percentage points) tend to have a 1.5 percentage point increase in social distancing. Similarly, counties with a higher fraction of the population with three or more individual risk factors specific to the Covid-19 pandemic (as defined by the Census Bureau) tend to socially distance more. We find no significant difference in social distancing based on the percentage of population without health insurance.
Second, economic conditions are a strong predictor of social distancing. Counties with a higher median income tend to stay at home more, in line with earlier finding that movement restriction is more pronounced in richer cities (PNAS, 2020; NYT 2020A, 2020B). On the other hand, education as proxied by the share of population with a bachelor degree is negatively correlated with socially distancing.
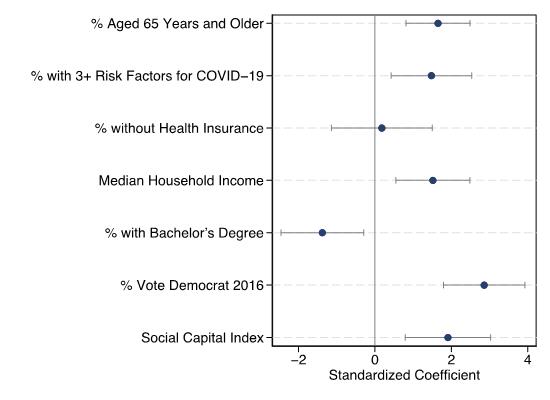
Another key element correlated with social distancing is politics; counties with a higher share of Democratic vote are more socially distanced. This effect is remarkably large and appears to matter more than health conditions such as age and risk factors. Just what this represents is not clear; voting behavior is influenced by a wide range of attitudes. But it confirms that the political divide in response to the Covid-19 pandemic is real and strongly correlated with behaviors as well as rhetoric.
Finally, social capital is an important factor behind reducing risks of infection. Social capital is an index that encompasses the presence of strong social networks, vibrant civil society, and trust in institutions. We rely on a social capital index that summarizes 10 economic, social, and demographic indicators measuring the strength of social networks such as the share of single households, number of nonprofit organizations, the share of mail-back response rate for the Census, or the number of violent crimes. Remarkably, counties with higher levels of social capital were on average significantly more prone to respect measures that stopped the spread of the virus. This suggests that having stronger norms of doing things together leads people to adopt more altruistic behaviors or elicits stronger reciprocity if it encourages the belief that other residents will be more likely to comply.
Responsiveness to Local Outbreaks
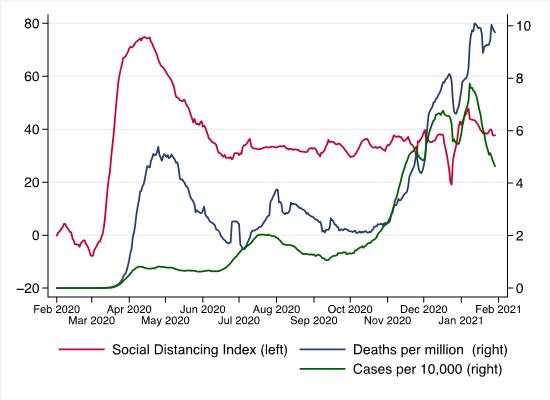
In addition to comparing levels of social distancing across counties, we also look at how compliance with social distancing is affected by the progression of the disease. Knowledge of the groups most susceptible to change their behavior in the face of higher risk of infection is important to control the spread of the disease. Overall, we find that social distancing is significantly responsive to local outbreaks, suggesting that individuals change their behavior in response to changes in the risk of exposure. As can be seen in Figure 4, this was especially true in the earlier stage of the pandemic from March to June 2020, but tended to attenuate between June to December 2020 as social distancing patterns plateaued despite a rise in deaths and cases.
To estimate how social distancing is responsive to the progression of the disease, we compare changes in social distancing after an increase in Covid-19 deaths in the last seven days and look for county characteristics associated with greater responsiveness (i.e., more social distancing when risks of exposure increases).
Figure 5 illustrates the important political and economic differences in responsiveness to local outbreaks. Overall, risk factors play less of a role in responsiveness to local outbreaks. This is not entirely surprising, and in line with the idea that vulnerable populations are socially distancing regardless of changes in infection rates.
On the contrary, counties with a higher share of individuals without health insurance are more responsive to local outbreaks. This suggests that the material risks of being infected are important for an adaptive behavior change in the face of greater risk. Other populations more responsive to local outbreaks include Democratic, more educated counties, and counties with a higher median household income, highlighting the economic and political divide in Americans’ responsiveness to the pandemic.
Lessons
As the pandemic continues to affect lives and the economy, understanding what drives compliance with health measures remains crucial and can allow for more tailored and effective action. We have learned that health factors are important determinants of levels of social distancing, but they are not the only ones. Economic conditions, political views, and the strength of social networks are important correlates of the adoption of social distancing behaviors. Moreover, higher levels of education and the absence of health insurance are associated with higher adoption of responsiveness when infections rise, while this is not the case for health vulnerability factors. This highlights the importance of information and the material cost of infection in the response to the evolving nature of the pandemic.