

A new study finds a steady decline in the quality of American jobs between 1979 to 2017, even as GDP has grown. This decline has been particularly severe for young workers and catastrophic for young workers without a college degree.
The anecdotal evidence is overwhelming: most full-time full-year workers cannot generate a decent standard of living for themselves, much less for a small family. This indictment is confirmed by the statistical evidence: last year, half of all workers were paid below $18.80 per hour (the median wage), and 20 percent were paid less than $11.91. According to the Economic Policy Institute’s Family Budget Calculator, it takes a wage of $14 to $18 per hour for a single full-time worker to cover a basic-needs budget, and between $24 and $32 for a single adult and one child.
While the wage paid for the vast majority of America’s jobs cannot adequately support a full-time worker and her child, wage growth has been explosive at the very top of the wage distribution, leading to an immense four-decade-long increase in wage inequality.
As dismal as this evidence seems for workers in the bottom half of the wage distribution, it has been all but contradicted by the conventional wisdom that job quality, measured by the incidence of low-wage jobs, has actually been stable, or has even improved. Referring to the US, as well as other rich countries, The Economist has argued that “it is wrong to conclude that workers are ever more exploited. The incidence of ‘low pay’—workers who earn less than two-thirds of the median—has been falling for two decades.”
With this indicator of low pay, the Organization for Economic Cooperation and Development (OECD) calculates that the share of low-paid American workers has shown no discernible change since 2000. Similarly, the Russell-Sage Foundation’s (RSF) path-breaking Low-Wage Work study concluded that low-pay incidence in the US “was already high in the 1970s and has changed little since then.”((Mason, Geoff and Wiemer Salverda. 2010. “Low Pay, Working Conditions, and Living Standards,” in J. Gautie and J. Schmitt, eds. Low-Wage Work in the Wealthy World (Russell-Sage Foundation), p. 36.))
But this comforting vision of stable or improving job quality for bottom-half workers badly misrepresents the reality, for at least two reasons. First, it relies on the longstanding practice of defining the incidence of low pay by reference to the median wage, a convention that dates back to the decades before 1980, when the median wage closely tracked economic growth and wage growth for workers in the bottom half kept up with those in the top half, even the top 1 percent.((See Piketty, Saez and Zucman. 2018. “Distributional National Accounts: Methods and Estimates for the United States.” Quarterly Journal of Economics, Vol. 133, Issue 2: 1-57.))
Since the early 1980s, while bottom-half workers have steadily and dramatically fallen behind those in the upper-half, wage inequality has not grown much for workers within the bottom half, which is what the conventional low-wage indicator measures. In other words, the share of workers with a wage below 2/3 of the median hasn’t changed much. In light of wage stagnation in the bottom half and the explosion of wage inequality in the top half since the late 1970s, it makes sense to supplement the conventional low-wage definition with one that captures at least some of the massive pulling-away of top-half workers from those earning below the median.((These results are for wage and salary workers from the Outgoing Rotation Groups of the Current Population Survey (CPS). For technical reasons, the mean wage in CPS survey data reflects wages only up to about the 95th percentile.))
Second, it has been typical to cite only the share of all workers earning low wages. But this masks the huge differences in the wage-quality of jobs across demographic groups. In fact, the relative stability of the share of workers earning low wages reflects a declining share of female prime-age workers earning low wages (mainly between 1979 and 2000) but sharply rising low-wage shares for most male workers, most young workers, and most workers without a college degree. For this reason, it is essential to look beyond the low-wage share for all workers to see what is happening for a variety of demographic groups. As I show below, this is particularly important for an understanding of what has happened to the quality of jobs for young workers.
| “All three indicators show that the wage-quality of jobs has declined for workers as a whole (ages 18-64) between 1979 and 2017, that the decline has been particularly severe for young workers (18-34), and that it has been catastrophic for young workers without a college degree.” |
In recent research, I have used both the average wage and the median wage as benchmarks (wage cutoffs) to generate three different job-quality indicators that measure the share of lousy-wage, low-wage, and decent-wage jobs, which are calculated for demographic groups defined by age, gender, education, race, and nativity.
The decent-wage benchmark defines the cutoff as two-thirds of the mean wage for full-time prime-age workers ($17.50 in 2017), and this threshold marks the divide between decent-wage and low-wage jobs. The lousy-wage benchmark is defined as two-thirds of the median full-time wage for all workers ($13.33 in 2017), which distinguishes low-wage from lousy-wage jobs. Given the pattern of inequality over the last four decades—exploding top-half inequality but little change in bottom-half inequality—the change in lousy-wage shares (defined with reference to the median) will tend to be lower than changes low-wage and decent-wage shares (defined with reference to the mean).
The upshot of my findings is that all three indicators show that the wage-quality of jobs has declined for workers as a whole (ages 18-64) between 1979 and 2017, that the decline has been particularly severe for young workers (18-34), and that it has been catastrophic for young workers without a college degree. Because the quality of female job opportunities improved, mainly prior to 2000, there has been a pronounced convergence in job quality between male and female workers (but not by race).
Another way to describe changes in job quality is relative to economic growth. I show that there has been a striking decoupling between the number (and share) of decent jobs from GDP growth. A likely consequence has been the decline in employment rates, and I find that these closely track declining job quality for both prime-age and young male and female workers (not presented here).
The Proliferation of Low-Wage and Lousy-Wage Jobs
The middle series in Figure 1 shows that the low-wage share of employment increased by about 6 percent between 1979 and 2017, from 39.1 to 45.2 percent for all workers (ages 18-64). The increase was almost as large for prime-age workers (ages 35-59), from 30.3 to 35.4 percent. But the headline story is the collapse in job quality for young workers (18-34): the low-wage share increased from 46.9 to 64.6 percent. As the figure shows, these increases in the low-wage share took place mainly after the 1980-82, 1990-91, 2001, and 2008-9 recessions.

Figure 2 presents results for the bottom tier of low-wage jobs: those that pay a lousy (or poverty) wage. Consistent with the OECD’s findings (for what it characterizes as the low-wage share), the lousy-wage share for all workers (the middle series) increased modestly over the last four decades, from 25.8 percent in 1979 to 28.8 percent at the end of 2017 (it had reached 31 percent in 2014).
This stability was driven by prime-age workers (the lower series), whose lousy-wage rate has fluctuated around 20 percent since 1979. Stability for prime-age workers through the late 1990s reflects two important underlying trends: rising lousy-wage job rates for men and falling rates for women (both have risen since 2000). Like the results for the low-wage share of employment seen in Figure 1, the lousy-wage rate exploded for young workers, rising from 31.5 to 42.8 percent between 1979 and 2017.

Outcomes were even worse for young workers without a college degree, and differences by gender are substantial. Figure 3 shows steadily worsening lousy-job rates for both young female and male non-college degree workers: from 51.8 to 66.4 percent for females and from 26.6 to 50.9 percent for males. Combined, these trends produced a large decline in the lousy-wage gender gap between 1979 and 2001, from 25.2 to 14.6 percentage points, which has remained about the same since (it was 15.5 points at the end of 2017).

The Decoupling of Decent Job Growth From Economic Growth
The poor earnings outcomes generated by the post-1979 American economy are conventionally explained by shifts in labor demand and supply: production technology is said to increase the demand for skilled workers and decrease it for the less-skilled (a process referred to as “skill-biased technical change”) together with a slowdown in the supply of workers with college degrees. Others have put greater emphasis on the growth of employer power over workers, as the effects of countervailing protective labor market institutions—unions, the minimum wage, and a variety of employment regulations—have declined (for a critical survey of these explanations and the evidence, see Howell and Kalleberg).
But a simpler explanation is commonly found in the business press: the low-wage problem is the slowdown in productivity growth. Faster productivity growth would, it is argued, increase wage growth, even for the bottom half of the distribution. Bloomberg Businessweek, for instance, has argued that “efficiency improvement could also allow companies to pay workers more without taking a hit to profits.” The report goes on to cite former Federal Reserve Chair Janet Yellen: “I think to really see a faster average pace of real wage growth, we need faster productivity.” The Economist has recently weighed in with the same logic of shared growth: “Pay is still increasing more slowly than might have been expected given the tightness of the labour market. For that, blame weak productivity growth.”
This productivity story suggests that wages move in lock-step with productivity, as in the early post-war decades. But the reality of the post-1979 American labor market has been that wage (and worker compensation) growth has steadily and dramatically decoupled from productivity growth. I also find a similar, sharp decoupling between two related indicators: the number (and share) of decent jobs and economic growth, as measured by the dollar value of gross domestic product.
The long diagonal line in Figure 4 shows the trend of the plot between GDP and the number of decent jobs during the 1980s expansion (from the second quarter of 1982 through the first quarter of 1991), which is extended through 2014. This extension shows what the number of decent jobs would have been in subsequent expansions had the 1980s relationship been maintained. Excluding recession years, separate trend lines are also shown for each of the three subsequent expansions.
This figure shows that if the relationship between the number of decent jobs and GDP during the 1980s expansion had been maintained—as GDP grew from $6.4 in 1979 to $16.2 trillion in 2014—there would have been 8.2 million more decent jobs by the first quarter of 2001, 13.9 million more by the fourth quarter of 2007, and 23.5 million more by the fourth quarter of 2014. The flat line for the most recent expansion indicates virtually no growth in the number of decent jobs during the 2009 to 2014 “expansion.” An even more extreme decoupling between GDP and the number of decent jobs took place (not shown) for young workers without a college degree (a shortfall of 10.9 million decent jobs); there was even a substantial decoupling for young college-degree workers (2.1 million decent jobs).

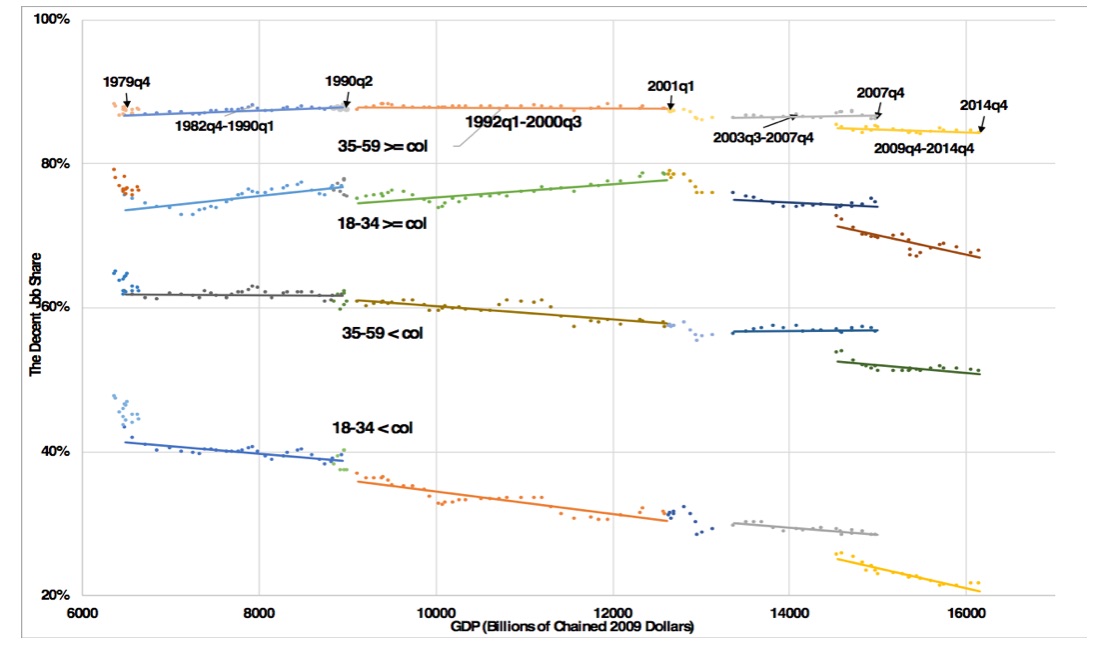
As Figure 5 shows, the failure of economic growth to translate into the creation of decent jobs is demonstrated by the share as well as the number of decent jobs. Young workers with a college degree (the second-to-the-top set of trend lines) experienced a modest increase in the share of decent jobs between 1979 and 2001, from 77 percent to 79 percent, but the share then dropped sharply to 68 percent in 2014 – as GDP grew from $12.6 to $16.2 trillion. Far worse, the decent-job share of young workers without a college degree (the bottom scatter plots) declined precipitously over these four decades, from a 45 percent share in 1979 to under 22 percent in 2014.
Policy Choices and the Collapse of American Job Quality
Measured by the incidence of lousy-, low- and decent-wage jobs, American job quality has declined substantially since the late 1970s, most disastrously for young workers without a college degree. This decline took place as both productivity and GDP increased. It also took place as educational attainment increased substantially. For example, the share of non-college degree workers with some college increased from 28 to 47 percent between 1979 and 2017.
The collapse in American job quality can be traced back to the late 1970s and then takes off in the early 1980s, the first years of the Reagan administration. The timing is no coincidence. As Angus Deaton explains, the U-turn towards exploding inequality is in large part due to political choices: “In the face of globalization and innovation, many of us would argue that American policy, instead of cushioning working people, has instead contributed to making their lives worse, by allowing more rent-seeking, reducing the share of labor, undermining pay and working conditions, and changing the legal framework in ways that favor business over workers.”
In Deaton’s words, these are “mechanisms of enrichment” that generate inequality “through upward transfers from workers,” a view consistent with the evidence presented here of a profound four-decade shift from decent to low- and lousy-wage jobs. The anecdotal and statistical evidence paints the same picture, and recent events in the political arena underscore the growing recognition by working families that the economy continues to be strongly rigged against them.