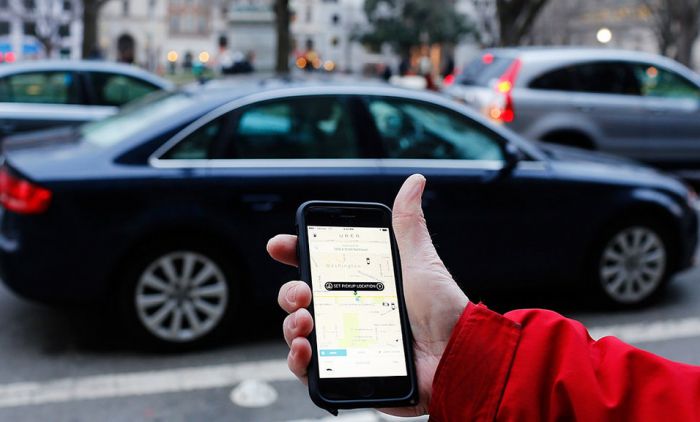
A new Stigler Center working paper finds that ride-sharing actually increases the number of new car registrations and fatal accidents.
Two years ago, the Stigler Center hosted a talk by David Plouffe, then chief advisor for Uber and a board member. In his speech, Plouffe promoted not only the convenience of the Uber model (most of us can attest to it), but also its environmental benefits: ride-sharing will reduce car circulation, congestion, and pollution. For the first time since the invention of the car, claimed Plouffe, urban planning was actually reducing parking space in city downtowns, because ride-sharing was reducing total demand for cars.
While high in rhetoric, his speech was short of actual data. If it was another kind of company, it would have been understandable—the phenomenon was so new that the data were not available yet—but Uber did have all the data. So why didn’t Plouffe use actual data to support his environmental claims?
The Impact of the Entry of Ride-sharing Services Into a City
A new Stigler working paper by John Barrios (University of Chicago), Yael Hochberg and Livia Yi (Rice University) casts doubts on the validity of those claims. Not only does the introduction of ride-sharing seem to not reduce congestion, it actually increases the number of car registrations by 3 percent. Most importantly, Barrios et al. find that the introduction of ride-sharing increases the number of fatal accidents by 3 percent (in the aggregate, this is equivalent to 987 extra lives lost every year in the United States alone).
The result might seem counterintuitive. Cheaper ride-sharing makes the option of leaving your car in the parking lot after a few drinks more attractive, reducing the risk of fatal accidents. In fact, this was precisely the intuition Barrios et al. had when they started their analysis. Yet, when they looked at the data on fatal accidents from the National Highway Traffic Safety Administration (NHTSA), the answer was very different. Exploiting the staggered entry of ride-sharing into different cities, the authors were able to measure the changes in accident trends in the eight quarters that preceded and followed the introduction of ride-sharing. As the figure below shows, there is a rise in fatal accidents following the entry of ride-sharing into a city (time zero):
The reasons for the increase can be twofold: worse drivers on the road or more traffic (or both). The authors do not have access to Uber’s or Lyft’s proprietary data, so they cannot test the “worse driver” hypothesis. However, they can test the “more traffic” hypothesis. If cheaper ride-sharing induces people to switch from public transportation to Uber or Lyft, we should expect the number of vehicle miles traveled to increase when a ride-sharing service enters. We should also expect fuel consumption and annual hours of delay to go up. They find evidence that all three measures rise following the entry of ride-sharing.
Barrios et al. also show that the increase in fatalities is more concentrated in cities (like New York) where the public transportation option is relatively good. This finding provides additional credibility that the mechanism they identify—shifting from public transportation to ride-sharing when the latter becomes cheaper—is the correct one.
Welfare Analysis
Buggies were safer than cars, yet today very few people would advocate for a return to buggies. More generally, the increased fatality rate could be a price worth paying. Fortunately, by using Uber’s individual-level data and its unique use of surge pricing, some researchers were able to estimate the consumer surplus produced by ride-sharing, which in 2015 amounted to $6.8 billion. As Barrios et al. remind us, the US Department of Transportation estimates the Value of a Statistical Life (VSL) at $9.6 million for 2015. Thus, when applying the VSL and assuming an annual increase of 987 lives lost per year, the annual cost of the increase in fatalities associated with ride-sharing can be estimated as roughly $9.48 billion per year—more than the consumer surplus generated.
If ride-sharing generates more costs than benefits, why has it become so popular? Do consumers irrationally ignore the costs? The answer is very simple: it is a classic externality. It’s not only the consumers of ride-sharing services that can die in accidents, but other drivers and pedestrians as well. Thus, the problem cannot be solved by banning or restricting ride-sharing services, but by forcing consumers to internalize the congestion costs via a gasoline tax or a congestion charge like the one developed in Singapore.
Conclusion
Remedies aside, the Barrios et al. piece reminds us of the value of good independent research in designing public policy. Independent research, however, can only take place when there’s unrestricted access to data. Government-produced data (like car fatalities) are available to everyone—Uber’s (and Lyft’s) data are not, which is why Barrios et al. cannot test the “worse driver” hypothesis. If Uber and Lyft are serious about improving safety, they should open their data (in anonymized form) to all researchers. Only if they do so, their claims would amount to more than sheer propaganda.
Disclaimer: The ProMarket blog is dedicated to discussing how competition tends to be subverted by special interests. The posts represent the opinions of their writers, not necessarily those of the University of Chicago, the Booth School of Business, or its faculty. For more information, please visit ProMarket Blog Policy.


