Hillary Clinton has promised to be tough on finance and pharmaceutical companies. So why do financial and healthcare stocks go up when the probability of a Clinton presidency increases?
In a couple of days, we will learn who is going to be the next president of the United States.
So far, much effort has been dedicated to forecasting the impact that the two main candidates will have on stock prices if elected (e.g. Justin Wolfers and Eric Zitzewitz, “What do financial market think of the 2016 election?”). On the other hand, relatively little attention has been dedicated to understanding which sectors would benefit more from the election of either candidate.
This question is particularly interesting because it reveals whether electoral platforms are credible or just a smoke screen. For example, Hillary Clinton promised to be tough with the financial industry, while Donald Trump promised to repeal the Dodd-Frank Act. How do financial sector stocks react when the probability of a Clinton victory goes up? What happens when it goes down?
We expect industries that would benefit from Clinton’s election to display positive excess returns when the probability of her victory increases, while the reverse should hold true when the likelihood of her success drops.
The last month has seen two major shocks that affected the probability of a Clinton victory: In the afternoon of October 7, the famous videotape showing Trump engaging in lewd conversation about women was released, leading to a drop in the likelihood that he’ll be elected. On October 28, the FBI announced new developments in the investigation of Hillary Clinton’s private email server, following the discovery of new emails—a decision that put Clinton in a weaker position just 10 days before the election.
We looked at the stock market reaction of the stocks contained in the S&P100, divided by industry sectors (measured according to the Global Industry Classification Standard). The reaction is measured as the two-day stock return around the announcement less the two-day stock market return during the same period (excess return).

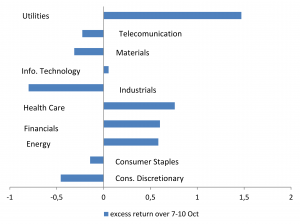
Figure 1 shows the excess returns for the first window. When Trump’s tape was released and Clinton’s chances of being elected increased as a result, the financial and healthcare sectors displayed a positive excess return. The opposite happened to firms in the industrial and consumer discretionary sectors (a group that encompasses casinos, hotels, resorts, and cruise lines).

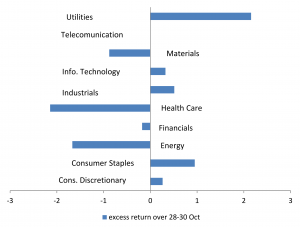
If we focus on the October 28-31 window, we observe (Figure 2) the opposite pattern. On the one hand, the financial and healthcare sectors showed a negative excess return. On the other hand, the consumer staples and consumer discretionary sectors gain. It is not difficult to foresee Trump reserving a favorable treatment for companies operating in these industries.
Industrial stocks also gained when the probability of a Trump victory increased, and lost ground when the probability of a Trump victory decreased (Figure 1). This is probably one of the sectors most affected by Hillary Clinton’s proposed increase in the minimum wage. Also, the materials sector seems to be negatively affected by the probability of a Democrat in the White House. One has to wonder whether this is the effect of the protectionary stance advocated by Trump.
The energy sector shows a somewhat strange pattern, since it gains when the probability of a Clinton presidency increases and drops with a decline in the probability of Trump winning the race. The latter result might be due to a contemporaneous drop in oil prices, which took place at the end of October. It is more difficult to interpret the first one. At the very least, we can say that the energy sector does not expect to be hurt by a Clinton presidency.
Notwithstanding the simplicity of our estimation strategy and some potential weaknesses, we can conclude that the biggest winners of a Clinton presidency would be the finance and healthcare sectors, while the biggest winners of a Trump presidency would be the consumer discretionary, consumer staples, and industrial sectors.
The data also seems to suggest that the market thinks Trump will deliver on his promises to help American manufacturing, but may it not put much trust in Clinton’s promises to be tough on banks and pharmaceutical companies.
Methodology
Our data sources are Bloomberg (for one-day stock returns and one-day market return) and fivethirtyeight.com (which we used to check when the jumps in electoral probability take place). Specifically, we collected data on S&P 100 firms’ returns over the relevant windows. With respect to the definition of the sectors we rely on the Global Industry Classification Standard (GICS).
Excess returns are calculated as the difference between realized one-day returns and the predict
ed returns. Predicted returns are represented by the market return multiplied by the estimated sector beta, namely the coefficient of the regression of the sector returns on the market return over an eight-month window (March-October).


