

30.7 percent of Clinton’s contributions came from donors who contributed more than $100,000. Clinton’s main super PAC raised $8.08 million in July–nearly all of it from donors who gave more than $100,000. A distribution analysis of the candidates’ donor pools shows that the top 0.1 percent of Clinton’s donors account for nearly 38 percent of her total campaign contributions.
Heading into the final stretch of the presidential election, Donald Trump continues to lag behind Hillary Clinton in the money race. While both Trump and Clinton managed to significantly boost their fundraising in July, the Stigler Center’s latest analysis of the candidates’ fundraising records shows that Clinton continues to outpace Trump, particularly when it comes to big donors.
The latest update of the Campaign Financing Capture Index—a Stigler Center project that tracks the attempts of large political contributors to affect public policy by focusing on the fraction of total funds raised from large donors—finds that, as of July 31, 30.7 percent of Clinton’s contributions came from donors who contributed more than $100,000. 44.3 percent of the $512.2 million raised by the Clinton campaign and its supporters came from donors who gave more than $5,000.

Trump, on the other hand, raised only 18.6 percent of his contributions so far from donors who gave more than $100,000, a decrease from 24.2 percent in June. As of late July, 30.9 percent of Trump’s contributions came from donors who gave more than $5,000.
Trump’s campaign fundraising relies heavily on smaller, direct mail, and digital donations. As of July 31, Trump raised $59.8 million from donors giving less than $5,000, an increase of $19.4 million since June.

The super PACs backing Hillary Clinton also significantly outraised the super PACs supporting Trump.
Clinton’s main super PAC, Priorities USA Action, raised $8.08 million in July–nearly all of it ($8 million) came from donors who gave more than $100,000. Priorities USA Action’s biggest donors in July were financier Donald Sussman, founder of Paloma Partners, and Slim-Fast founder S. Daniel Abraham, donating $3 million each. Both are among Clinton’s biggest contributors: Sussman, the biggest contributor to Priorities USA Action, has given $11 million during this election cycle, while Abraham has contributed $6 million so far.
In addition, the Laborers’ International Union of North America donated $1 million to Priorities USA Action in July. Ann Doerr, the wife of venture capitalist John Doerr, contributed $500,000, as did medical device heiress Pat Stryker. Jay Robert and Mary Kathryn Pritzker also contributed $450,000 each.
Trump’s main super PAC, Great America PAC, only raised $0.7 million in July, with just one donation over $100,000—from billionaire Charles Johnson, owner of the San Francisco Giants.
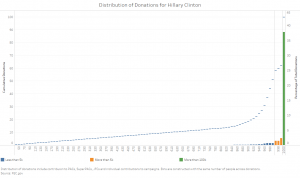
Clinton’s top 0.1 percent of donors account for 37.8 percent of her total contributions
A special review also shows stark differences in the size and distribution of Trump’s and Clinton’s contributions, reflecting the different sources of their donations. When it comes to the overall per capita donations received by each candidate, Clinton’s national per capita is $1.23, while Trump’s is only $0.14.
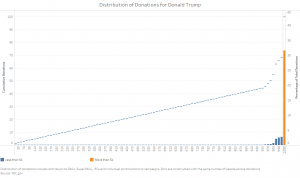
A distribution analysis of the candidates’ donations shows the differences between the candidates’ donor pools. The top 0.1 percent of Clinton’s contributors accounts for 37.8 percent of the total donations she received (the average donation in the top 0.1 percent is $146,277). Donald Trump, however, has received few donations over $100,000. The top 0.1 percent of his contributions accounts for 31.6 percent of his total (the average donation in the top 0.1 percent for Trump is $33,744).((The distribution of donations includes contribution to PACs, super PACs, JFCs, and individual contributions to candidates’ campaigns (source: FEC). The distribution is calculated by dividing the set of all individual donations into 1,000 buckets with an equal number of donations for each candidate, then calculating the total amount raised by each bucket. Each candidate therefore has his/her own distribution of donations. The dashed line represents cumulative donations. The bars represent the percentage of total donations. While we have computed 1,000 buckets, we plot a selection of 100 for readability (labeled in the X axis ).))
A state-by-state breakdown also shows stark differences in the geographical distribution of the candidates’ contributions. This, of course, is not new in itself: political preferences vary from state to state, and each candidate has states where he or she does better than others.((The state-by-state breakdown is based on individual contributions to each candidate above $200 dollars, based on their FEC filings (which include donations given to PACs, super PAC
s, and JFCs) up to July 2016, together with the total population in each state. We summed up the contributions from each state and divided them by the total population of that state. (Under FEC rules, campaigns are not required to disclose any information about donors giving less than $200 dollars, therefore we do not observe any geographic area for these donations and they are not included in this analysis).))
Nevertheless, as you can see in the interactive map below, the per capita distribution of the contributions given to each candidate shows where they are strongest. Clinton, unsurprisingly, does best in densely populated areas, such as New York, California, Washington DC, and Illinois. Trump, on the other hand, does best in Southern states like Florida, Texas (where Clinton is also doing well), Arkansas, and Nevada.
Trump, on the other hand, does best in Southern states like Florida, Texas (where Clinton is also doing well), Arkansas, and Nevada.
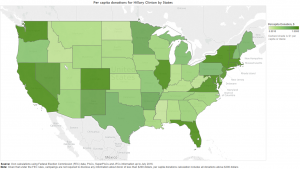
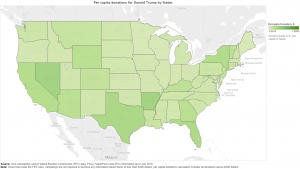
The data shows that Trump’s donations fluctuate between $0.0346 per capita in Minnesota and $0.3501 in Arkansas. Clinton’s, meanwhile, vary between $0.11 per capita in North Dakota and Mississippi to $19 per capita in Washington DC. In California, Trump’s contributions per capita amount to $0.2101, while Clinton’s per capita in the state is $2.54.
The Campaign Financing Capture Index was launched in March. It analyzes the distribution of political contributions to presidential candidates and takes into account individual contributions and contributions made to the PACs, super PACs, and joint fundraising committees that support each candidate. It is our belief that large political contributions represent more than the mere expression of political preference and are more likely meant to influence policy in favor of the donor’s interest. When the percentage of funds raised from large donors is increasingly significant, as it has been in recent years, this problem becomes more acute.
The analysis was done based on data collected from the FEC website, and comprises individual contributions made to campaigns, main super PACs, PACs, and JFCs since the beginning of the race until July 31. The Stigler Center will publish a concentration and distribution analysis every three months until the presidential elections.